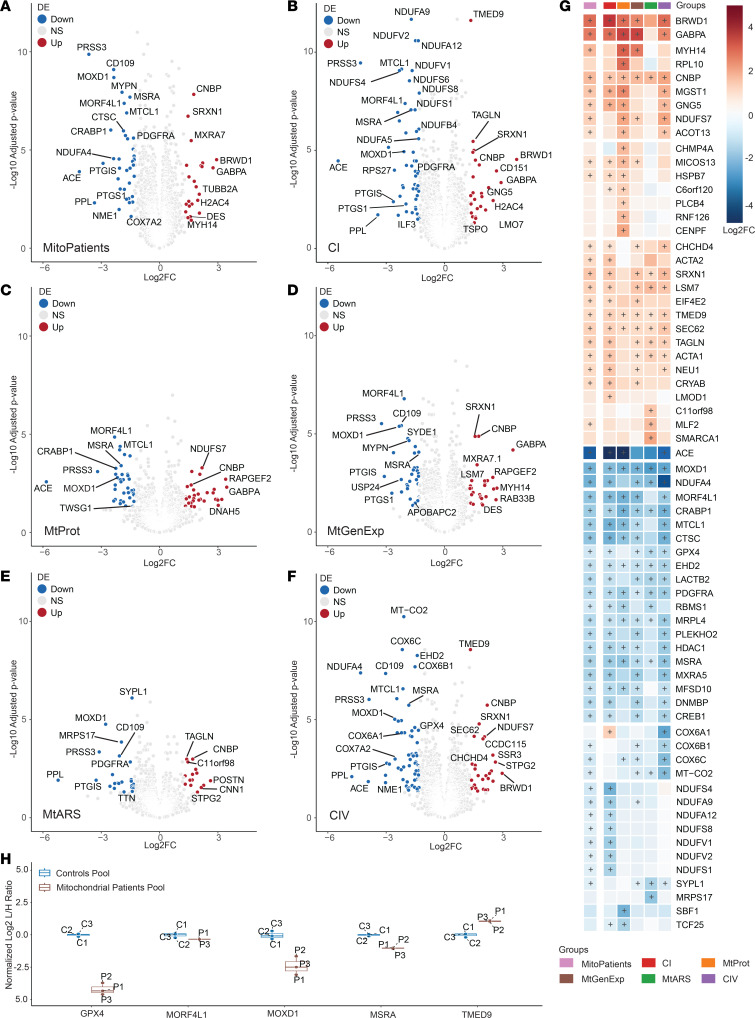
Figure 3. Differential expression analysis reveals biomarkers of mitochondrial disease.
Volcano representation of differentially expressed (DE) proteins in groups versus controls in (A) Mitochondrial disease patients (MitoPatients); (B) CI; (C) MtProt; (D) MtGenExp; (E) MtARS; (F) CIV. Significantly changed proteins (Log2FC > 1.3 or Log2FC < –1.3, adj. P < 0.05) are shown in red (increased) and blue (decreased). P values were adjusted with Benjamini-Hochberg method and are presented in –Log10 scale (–Log10 adjusted P). (G) Heatmap of curated DE proteins, identified in at least 1 of the above comparisons, colored by Log2 fold-change versus average control (Log2FC) and further annotated with (+) if significantly differentially expressed (adj. P < 0.05) in the specific comparison. (H) Boxplot of DE proteins of interest, obtained from parallel reaction monitoring mass spectrometry (targeted proteomics) in pooled control (C1–C3) and patient samples (P1–P3). C/P1–C/P3 number indicates technical replicate. Ratios between endogenous peptides (light) and spiked isotope labeled standards (heavy) were determined, normalized to the mean of the control values and Log2 transformed (Log2 L/H Ratio).

