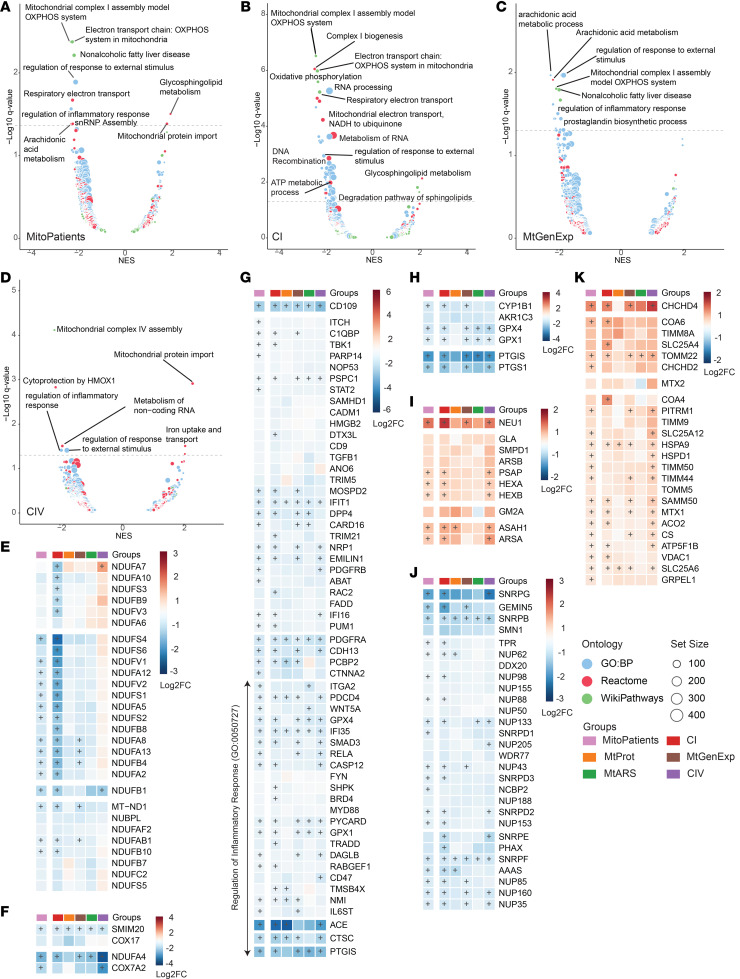
Figure 4. GSEA volcanos and pathway heatmaps.
GSEA reveals pathways altered in mitochondrial disease. Volcano plot of GSEA in groups versus controls in (A) All Mitochondrial Patients (MitoPatients); (B) CI; (C) MtGenExp, and (D) CIV. Circle diameter denotes set size while color denotes annotation source (blue, GO:BP; red, Reactome; green, WikiPathways). Differentially enriched gene sets are labeled according to a normalized enrichment score (NES) > 1.3 or < –1.3 and a q value < 0.05 (presented as –Log10 q value). Enriched gene sets were further investigated and protein heatmaps were prepared for (E) Mitochondrial Complex I Assembly (WP4324); (F) Mitochondrial Complex IV Assembly (WP4922); (G) Response to External Stimulus (GO:0032101), including Regulation of Inflammatory Response (GO:0050727); (H) Arachidonic Acid Metabolism (R-HSA-2142753); (I) Glycosphingolipid Metabolism (R-HSA-1660662); (J) Metabolism of Noncoding RNA (R-HSA-194441) and (K) Mitochondrial Protein Import (R-HSA-1268020). Individual gene set proteins are colored by Log2 FC versus average control (Log2FC) and further annotated with (+) if significantly differentially expressed (adj. P < 0.05) in the specific comparison.

