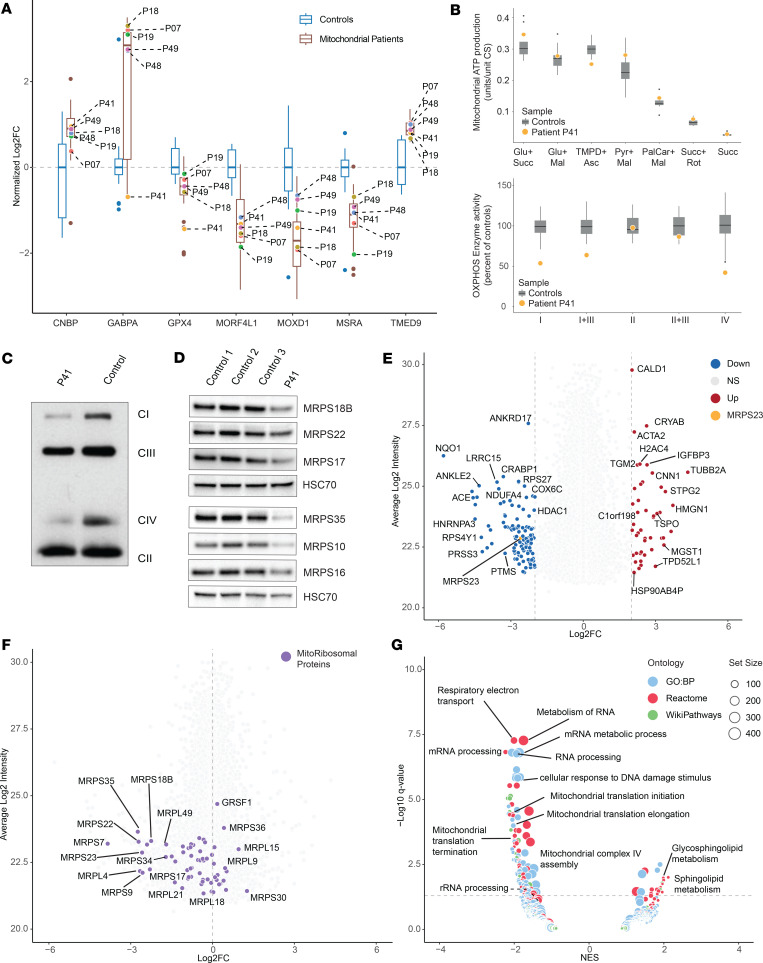
Figure 5. Proteomics analysis supports diagnosis of mitochondrial disease.
Proteomics data aids in the diagnosis of an unsolved case. (A) Expression levels of the potential biomarkers identified in DE analysis in the 6 VUS cases. Blue boxplots represent the control cohort while brown boxplots indicate the patient cohort. Values are normalized to median intensity of control cohort in Log2 scale (Normalized Log2FC). Labeled dots denote the VUS cases (genes): P07 (HTRA2), P18 (POLRMT), P19 (QRSL1), P41 (MRPS23), and P48 and P49 (COX20). (B) Mitochondrial ATP production rate (units/unit CS), was determined with the indicated substrate combinations. Boxplots represent the distribution of values for control individuals (n = 11, age 12–57 years) with the individual colored circle representing the value determined in the patient. Respiratory chain enzyme activities of complex I, complexes I + III, complex II, complexes II + III, and complex IV were determined in isolated mitochondria and adjusted to CS activity. Results are presented as percentage of mean control values with boxplots representing the distribution of values for control individuals (n = 15–42; age 5–70 years) and the individual colored circle representing the value determined in the patient. (C) BN-PAGE of mitochondria isolated from muscle from patient (P41) and a control individual. Enzyme complexes I–IV (CI–IV) were detected by Western blot with appropriate antibodies. (D) Western blot analysis of patient and control fibroblasts. HSC70 (heat shock protein family A[Hsp70] member 8) was used as loading control and protein signal was determined as described with appropriate antibodies. (E) Volcano plot of total proteomes for P41 (n = 1) versus controls (n = 17). Up or downregulated proteins (Log2FC > 2.5 or Log2FC < –2.5) are shown in red (increased) and blue (decreased), respectively. MRPS23 protein is labeled in orange. Average Log2 Intensities calculated from individual intensities of the entire dataset (patient and controls). (F) Volcano plot from E with mitochondrial ribosomal proteins emphasized in purple. (G) Volcano plot of GSEA analysis of P41 DE results, circle diameter denotes set size while color denotes annotation source (blue, GO:BP; red, Reactome; green, WikiPathways). Differentially enriched gene sets are labeled according to a normalized enrichment score (NES) > 1.3 or < –1.3 and a q < 0.05 (presented as –Log10 q value).

