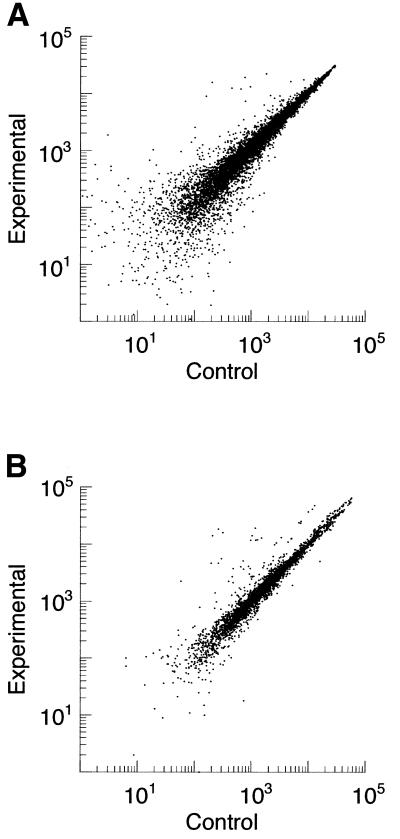
Figure 3.
Representative scatter plot of expression level data from oligonucleotide and cDNA array experiments. (A) Oligonucleotide array. Scatter plot of positive average perfect match minus mismatch values from all genes on two arrays, one hybridized with a control sample and the other with an experimental sample is shown. (B) cDNA array. Background subtracted signal intensity measurements for all genes contained on the cDNA array from one experiment with control and experimental samples. Note the tight clustering of most data about y = x.

