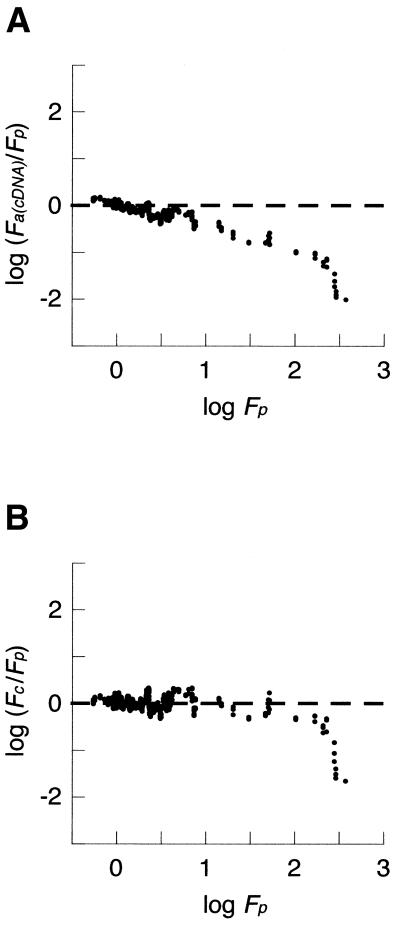
Figure 7.
cDNA array bias and calibration. (A) The ratios obtained by cDNA arrays and by QRTPCR [log (Fa(cDNA)/Fp)] are plotted against the ratio determined by QRTPCR (log Fp) as a moving average with a window of 10 values. Note the predictable correlation of the bias error with increasing fold-change values and a saturation effect of log Fa(cDNA) measurements when (log Fp < 2.4). Unbiased data would show a balanced distribution about y = 0 (dashed line). (B) Calibrated cDNA data. All fold-change ratios were calibrated, as described, and the resulting bias plot is shown as a moving average with a window of 10 values. Fc are the calibrated cDNA array-derived relative expression ratios. Note the even distribution about y = 0 for all except the most extreme changes, indicating that the calibration has reduced bias for measurements within this range.

