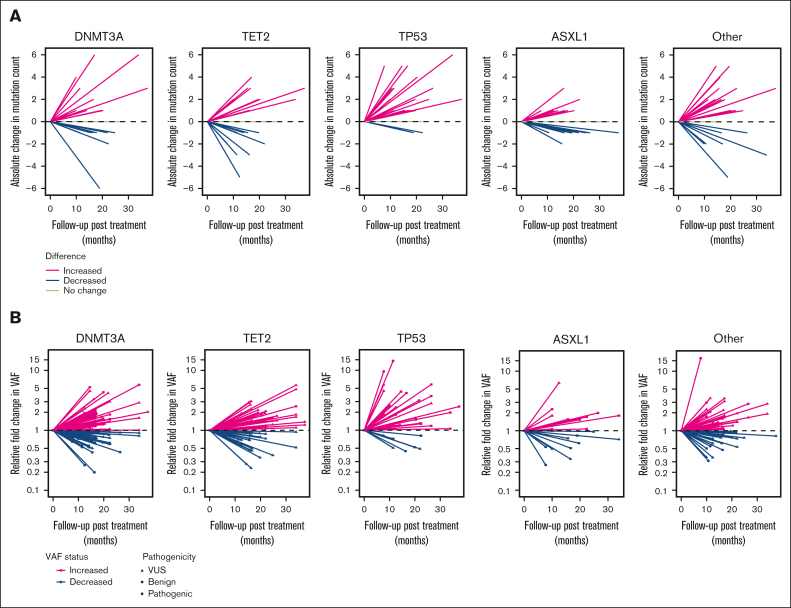
Figure 3.
Changes in variant count and VAF before treatment to last follow-up by gene. (A) Line plot in which each line represents an individual study participant and shows the absolute change in the number of mutations before treatment to last follow-up. (B) Line plot in which each line represents an individual mutation and the relative fold change in VAF before treatment to last follow-up. VUS, variant of uncertain significance.

