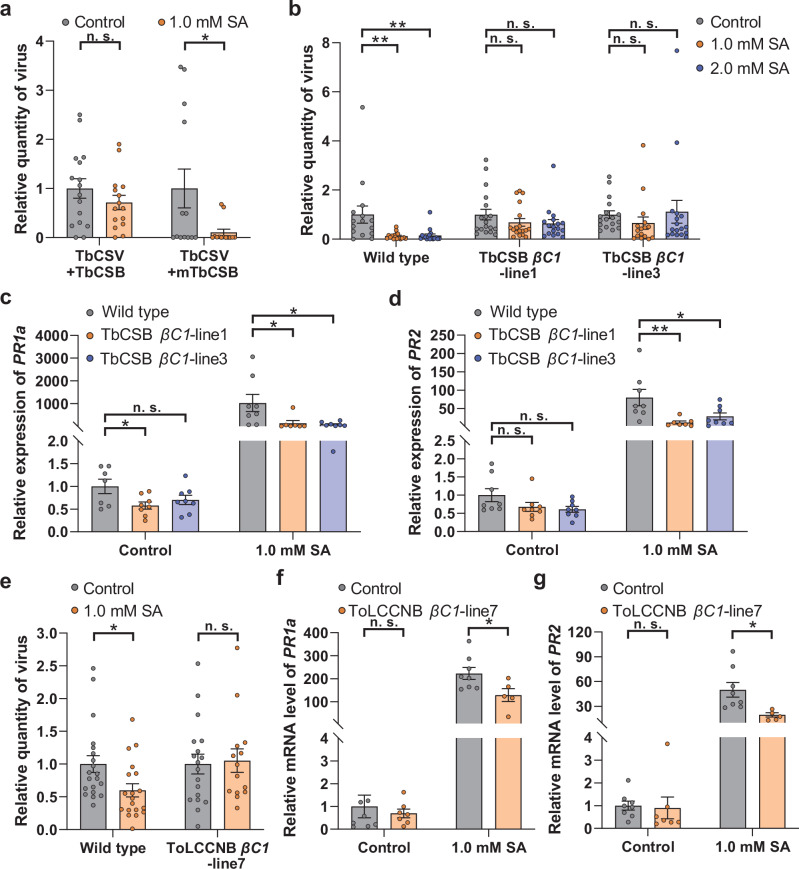
Fig. 2. βC1 mitigates the deleterious effects of SA treatment on begomoviruses infection and interferes with SA signaling.
a Quantity of TbCSV in N. benthamiana plants that were first sprayed with ethanol (control) or SA and then inoculated with TbCSV+TbCSB or TbCSV+mutant TbCSB (mTbCSB). b Quantity of TbCSV in wild type and transgenic N. benthamiana plants that were first sprayed with ethanol (control) or SA and then inoculated with TbCSV; c, d Relative mRNA level of PR1a (c) and PR2 (d) in wild type and TbCSB βC1-transgenic N. benthamiana plants that were sprayed with ethanol (control) or SA. e Quantity of ToLCCNV in wild type and transgenic N. benthamiana plants that were first sprayed with ethanol (control) or SA and then inoculated with ToLCCNV. f, g Relative mRNA level of PR1a (f) and PR2 (g) in wild type and ToLCCNB βC1-transgenic N. benthamiana plants that were sprayed with ethanol (control) or SA. N = 13–16 plant for (a), 16–18 plants for (b), 7–8 samples (2-3 plants per sample) for (c, d), 14–20 plants for e, 5-8 samples (2-3 plants per sample) for e and f. Data are mean ± SEM. n. s. stands for no significant difference, *P < 0.05, and **P < 0.01 (one-way ANOVA for b-d; two-sided Student’s t test for a, e–g). Source data and the exact P values are provided in Source Data file.

