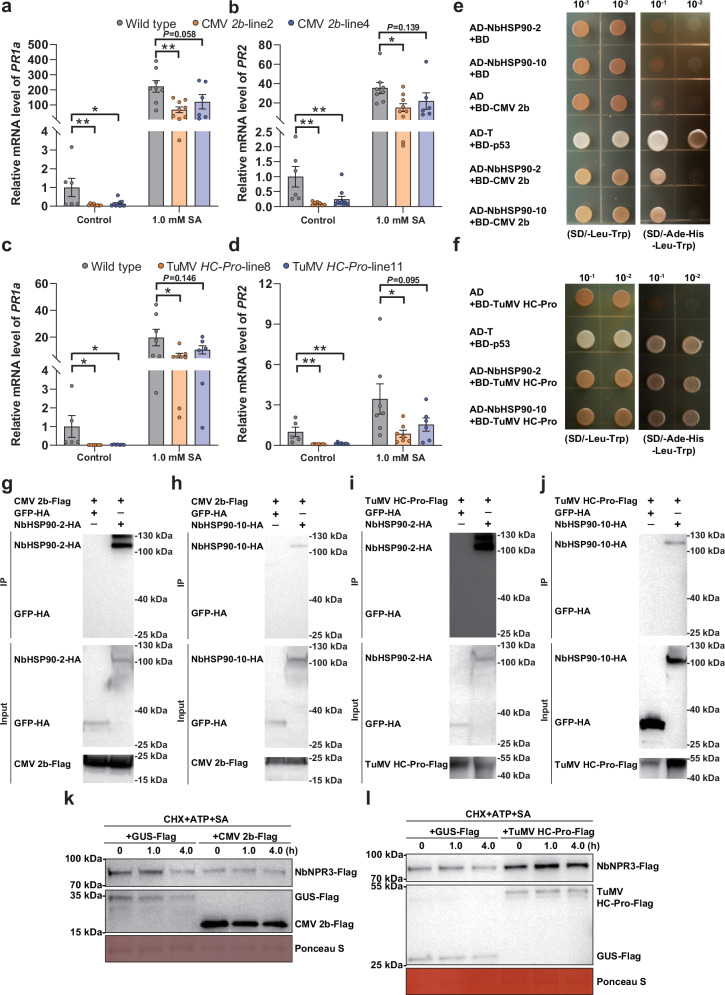
Fig. 7. Viral proteins encoded by aphid-borne plant viruses target NbHSP90s and NbNPR3 for the suppression of SA signaling.
a, b Relative mRNA level of PR1a (a) and PR2 (b) in wild type and CMV 2b-transgenic N. benthamiana plants. c, d Relative mRNA level of PR1a (c) and PR2 (d) in wild type and TuMV HC-Pro-transgenic N. benthamiana plants. e, f Interactions between CMV 2b (e) or TuMV HC-Pro (f) with NbHSP90s in a yeast two-hybrid assay. Yeast strain AH109 transformed with the indicated plasmid combinations was spotted with 10-fold serial dilutions on synthetic dextrose media SD/-Leu-Trp and SD/-Ade-His-Leu-Trp. g, h Interaction between CMV 2b and NbHSP90-2 (g) or NbHSP90-10 (h) in the co-IP assay. CMV 2b-Flag and NbHSP90-2-HA were co-expressed and CMV 2b-Flag+GFP-HA served as a negative control. i, j Interaction between TuMV HC-Pro and NbHSP90-2 (i) or or NbHSP90-10 (j) in the co-IP assay. k, l Effect of CMV 2b (k) and TuMV HC-Pro (l) on the SA-induced degradation of NbNPR3-Flag in the semi-in vivo assays. NbNPR3-Flag was co-expressed with CMV 2b-Flag (or TuMV HC-Pro) or GUS-Flag (control). Protein extracts were mixed with CHX, ATP and SA and then subjected to semi-in vivo protein degradation. NbNPR3-Flag protein was analyzed with anti-Flag antibodies at different time points. Ponceau S staining was performed to determine the amount of protein load. N = 6–10 samples (2–3 plants per sample) for (a, b), 5–7 samples (2–3 plants per sample) for (c, d). Data are mean ± SEM. n. s. stands for no significant difference, *P < 0.05, and **P < 0.01 (one-way ANOVA for a–d). Source data and the exact P values are provided in Source Data file.

