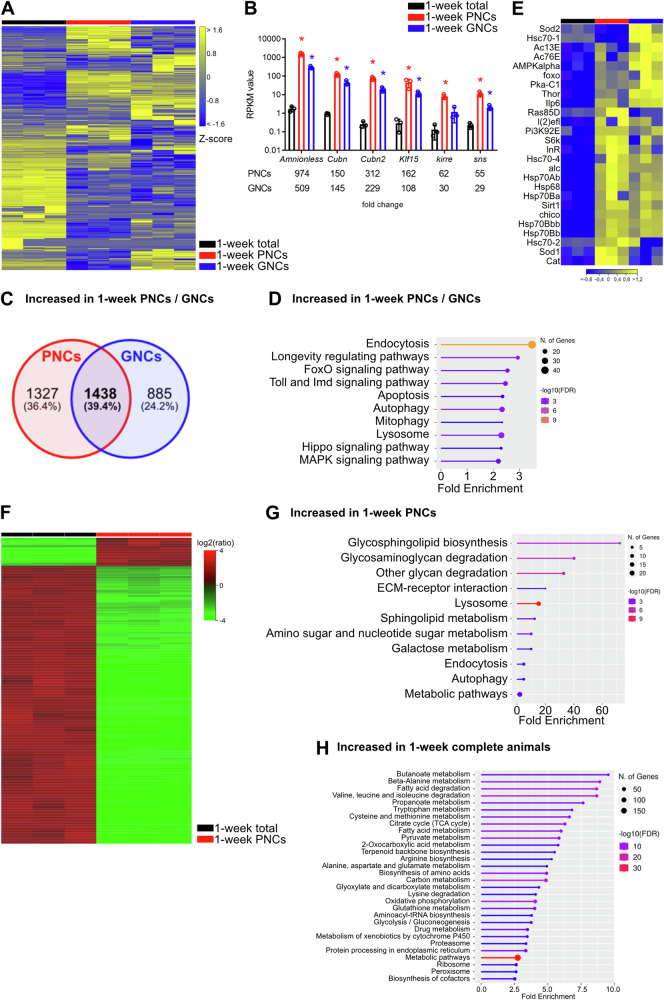
Fig. 2. Core characteristics of nephrocytes at the transcript and protein level.
A Heatmap of RNAseq replicates (minimum fold change 1.5, FDR p value cutoff 0.05) from total animals (black bar), PNCs (red bar) and GNCs (blue bar). B RPKM values of Amnionless, Cubilin (Cubn) and Cubilin 2 (Cubn2), Kruppel-like factor 15 (Klf15), sticks and stones (sns), and kin of irre (kirre) in the three groups. The corresponding fold changes relative to complete animals are shown in the lower panel. Asterisks indicate a differential expression of the respective gene compared to the total animals. C Venn diagram of 2765 upregulated genes in PNCs and 2323 upregulated genes in GNCs, relative to total animals; 1438 genes (39.4%) were shared between the two groups. D KEGG pathway enrichment analysis of the shared genes. E Heatmap of genes associated with the ‘Longevity regulating pathway’ (KEGG) depicting alterations for the RNA-seq groups and replicates. F Heatmap of proteome replicates from total animals (black bar) and PNCs (red bar). G KEGG pathways enriched in PNCs, relative to complete animals. H KEGG pathways enriched in complete animals, relative to PNCs.

