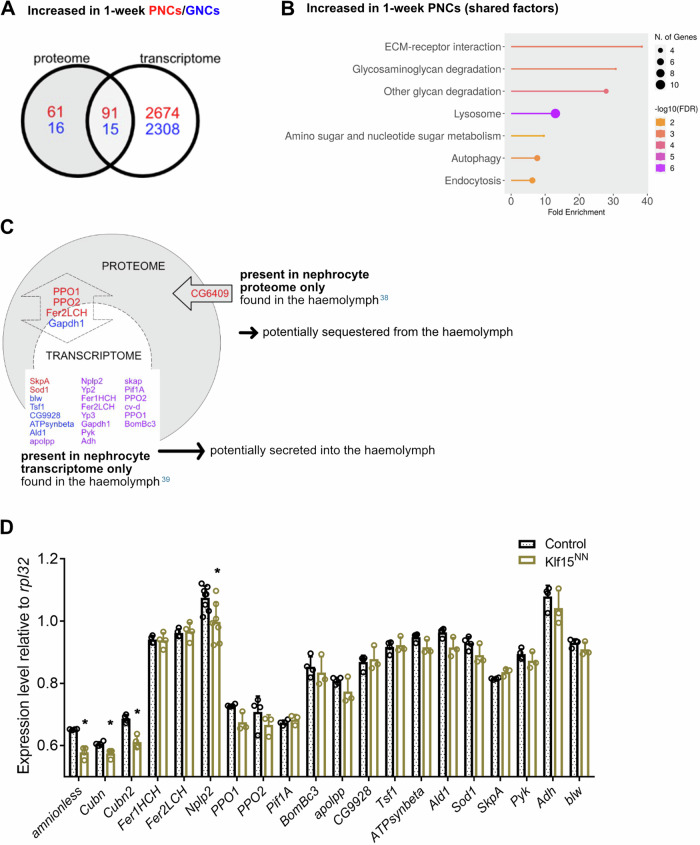
Fig. 3. Correlative analyses of the nephrocyte transcriptome and proteome.
A Red: Venn diagram of 152 proteins enriched in PNCs and 2765 genes upregulated in PNCs, relative to total animals; 91 proteins/genes were shared between the two groups, which corresponds to 59.9% of the enriched proteins. Blue: Venn diagram of 31 proteins enriched in GNCs and 2323 genes upregulated in GNCs, relative to total animals; 15 proteins/genes were shared between the two groups, which corresponds to 48.4% of the enriched proteins. B KEGG pathway enrichment analysis of the shared factors. C Analysis of factors present only in the nephrocyte proteome (arrow), only in the nephrocyte transcriptome (dashed circle), or in both (double arrow). Factors in red font were detected only in PNCs, factors in blue font only in GNCs, and factors in purple font were detected in both cell types. D Quantitative RT-PCR of the genes expressed in 1-week-old animals with depleted nephrocytes (Klf15NN), relative to wildtype (w1118). Mean and SD are shown, n = 4, *p = <0.05, Mann–Whitney U test.

