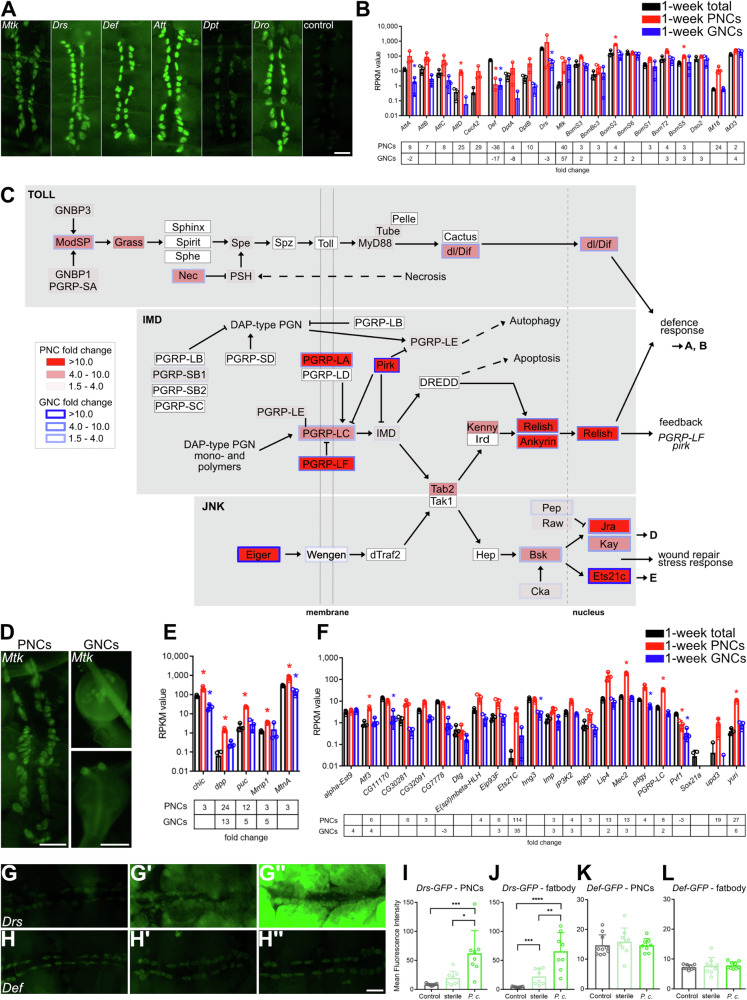
Fig. 4. Nephrocytes exhibit increased expression of Toll, Imd and JNK signalling components.
A Expression of different antimicrobial peptides in PNCs indicated by GFP reporter activity. Control animals (w1118) do not exhibit any signal above background. Scale bar: 100 µm. B RNAseq RPKM (Reads Per Kilobase Million) values of defence response target genes in PNCs and GNCs, relative to complete animals (total). The lower panel depicts the expression fold changes in PNCs and GNCs relative to the total animals. C Schematic representation of Toll, Imd and JNK signalling pathways. RNAseq fold change of PNCs (red background) and GNCs (blue frame), relative to total animals, is indicated by colour coding. Insignificant differential expression of a component is indicated by a white fill (PNCs) or a fine black border (GNCs). Connected pathways are depicted by dashed arrows. Targeted processes downstream of the three pathways are shown to the right. D Mtk-GFP reporter expression in PNCs (left) and GNCs (right). Scale bars: 100 µm. E RPKM values of JNK target genes regulated by Jra/Kay in PNCs (red) and GNCs (blue), relative to complete animals. The lower panel depicts the corresponding expression fold changes. F RPKM values of JNK target genes regulated by Ets21c in PNCs (red) and GNCs (blue), relative to complete animals. The lower panel depicts the corresponding expression fold changes. Asterisks indicate a differential expression of the respective gene compared to the total animals (B, E, F). G–L Uninfected PNCs of Drs-GFP and Def-GFP reporter lines (G, H) compared to sterile infected (G’, H’) and Pectobacterium carotovorum (P.c.) infected adults (G”, H”). Scale bar: 1 mm. The mean fluorescence intensity of PNCs (I, K) and the adjacent fatbody cells (J, L) was quantified. Mean and SD are shown, n > 8, *p = <0.05, **p = <0.01, ***p = <0.001, ****p = <0.0001, Mann–Whitney U test.

