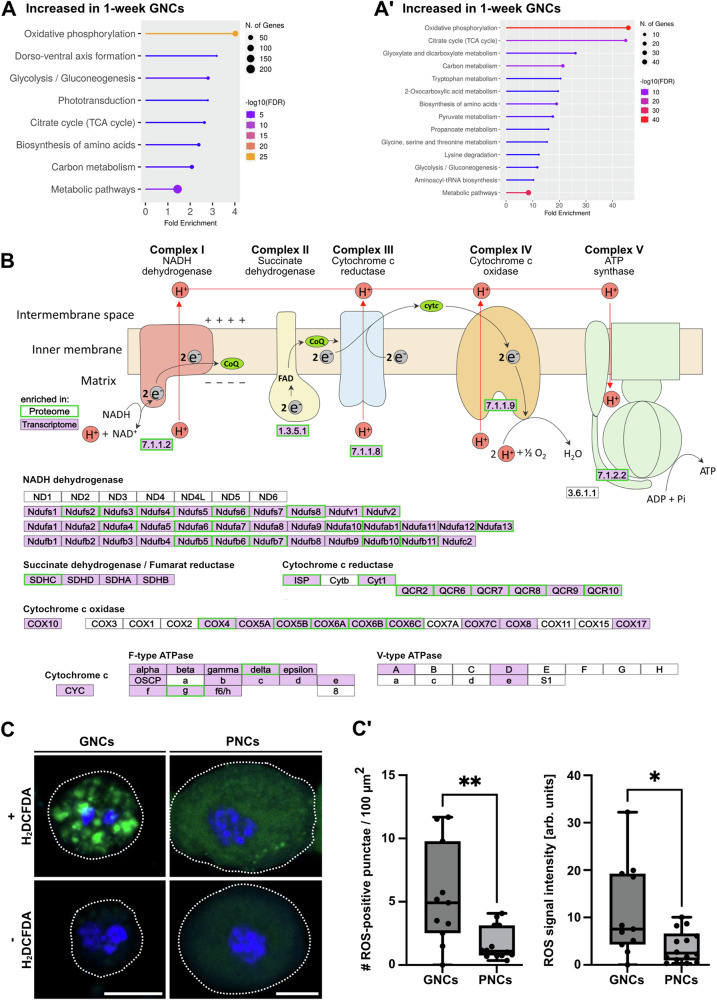
Fig. 6. Nephrocytes exhibit transcriptomic and proteomic signatures indicative of a cell-type-specific energy metabolism.
A KEGG pathways (transcriptome-based) enriched in 1-week-old GNCs, relative to 1-week-old PNCs. (A´) KEGG pathways (proteome-based) enriched in 1-week-old GNCs, relative to 1-week-old PNCs. B Scheme depicting factors relevant to oxidative phosphorylation (KEGG pathway). Transcripts (purple background) and proteins (green frame) with significantly increased abundance in GNCs, relative to PNCs, are highlighted. C Isolated GNCs and PNCs with or without the addition of a ROS indicator (H2DCFDA, green channel). DAPI was used as a counter stain to visualise the nuclei (blue channel). A dotted line indicates the cell perimeter. Scale bars: 10 µm. (C´) The number (#) of ROS-positive punctae and the overall ROS signal intensity were determined by pixel intensity measurements. Signal intensities were normalised to corresponding control cells without the ROS indicator. For both boxplots, the centre line indicates the median, the upper and lower bounds indicate the 75th and 25th percentiles, respectively, and the whiskers indicate the minimum and maximum. For each analysis, a minimum of 10 individual cells was measured. Asterisks indicate statistically significant differences between the two cell types (*p < 0.05, **p < 0.01, Mann–Whitney U test).

