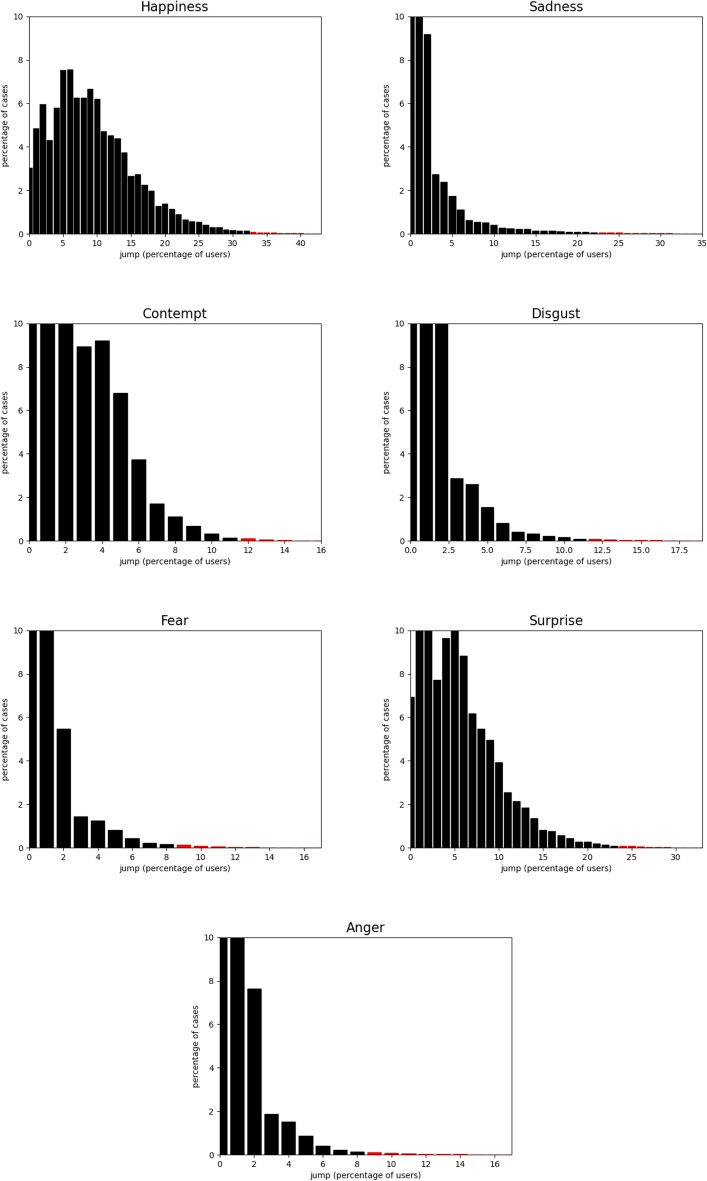
Fig. 5.
System1’ Test Your Ad dataset: Distribution of 5-second clips based on the percentage of users expressing various emotions. The x-axis shows the response strength as the percentage of viewers feeling the emotion. The y-axis shows the percentage of clips evoking that response level. Clips in the top 0.5% of the distribution (highlighted red) were used to define the emotional jumps, which were labeled for classifier training and testing.

