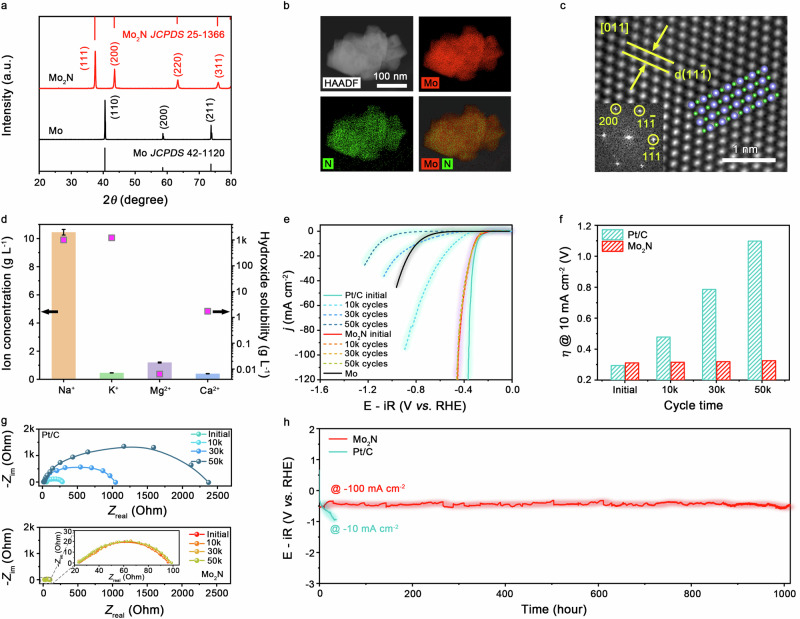
Fig. 1. Electrocatalytic performance of Mo2N in natural seawater.
a XRD patterns of Mo and Mo2N. b STEM-EDX elemental mapping of Mo2N, showing the homogeneous distribution of Mo (red) and N (green), respectively. c HRTEM image of Mo2N. Insets show the corresponding FFT pattern and atomic model viewed along the same direction. d The concentration of typical ions in natural seawater and the solubility of the corresponding hydroxides. Error bars are based on the standard deviation of three independent measurements. e HER polarization curves of Mo, Mo2N, and commercial Pt/C catalysts before and after different potential cycles in natural seawater at room temperature (100% iR correction, where R was determined to be 23.7 ± 0.2 Ω). Catalyst loading: ~1.0 mg cm−2. Sweep rate: 5 mV s−1. Rotation rate: 1600 rpm. f The increase in overpotential at 10 mA cm−2 for Mo2N and Pt/C catalysts before and after different potential cycles. g EIS Nyquist plots of Mo2N and Pt/C catalysts before and after different potential cycles. Inset shows the enlarged EIS Nyquist plots of Mo2N. h Chronopotentiometry curves of Mo2N and Pt/C catalysts performed in natural seawater.

