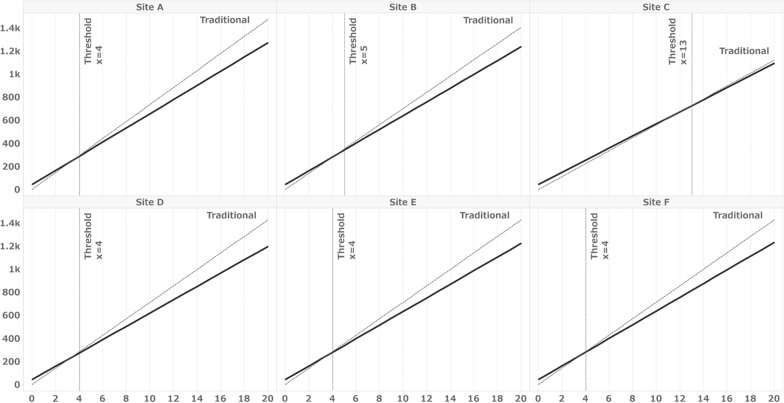
Fig. 4.
Simulation results for Sites A to F under the conditions listed in Table 4. X = number of subjects, Y = work hours, solid line: eSource DDC, broken line: traditional method. Thresholds: The minimum number of subjects for which the overall hours with eSource DDC are less than those for a clinical trial conducted using the traditional. Table 4 shows the percentage of initial entrants for the forms defined as DDC at all sites. The number of fields included in the form defined as DDC common to all facilities in Table 4 was used as the condition for this simulation as the number of DDC fields

