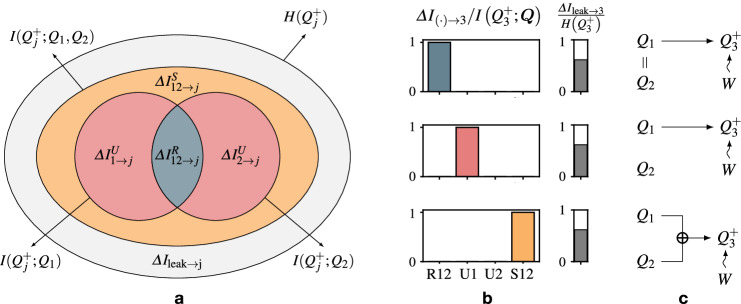
Fig. 1. SURD: Synergistic-Unique-Redundant Decomposition of causality.
a Diagram of the decomposition of causal dependencies between a vector of observed variables Q = [Q1, Q2] (past) and a target variable (future) into their synergistic (S), unique (U) and redundant (R) components (in yellow, red, and blue, respectively) and contributions to the total, , and individual, , mutual information. The causality leak is represented in gray. A version of this diagram for three variables is shown in the Supplementary Materials. b Redundant, unique, and synergistic causalities for the simple examples of (c) a duplicated input (top panel), an output equal to the first input (middle panel), and an exclusive-OR output (bottom panel). The notation used is such that . The target variable is affected by external stochastic forcing W, which is independent of the observed variables in Q. The effect of W is measured by the causality leak, represented by the gray bar.

