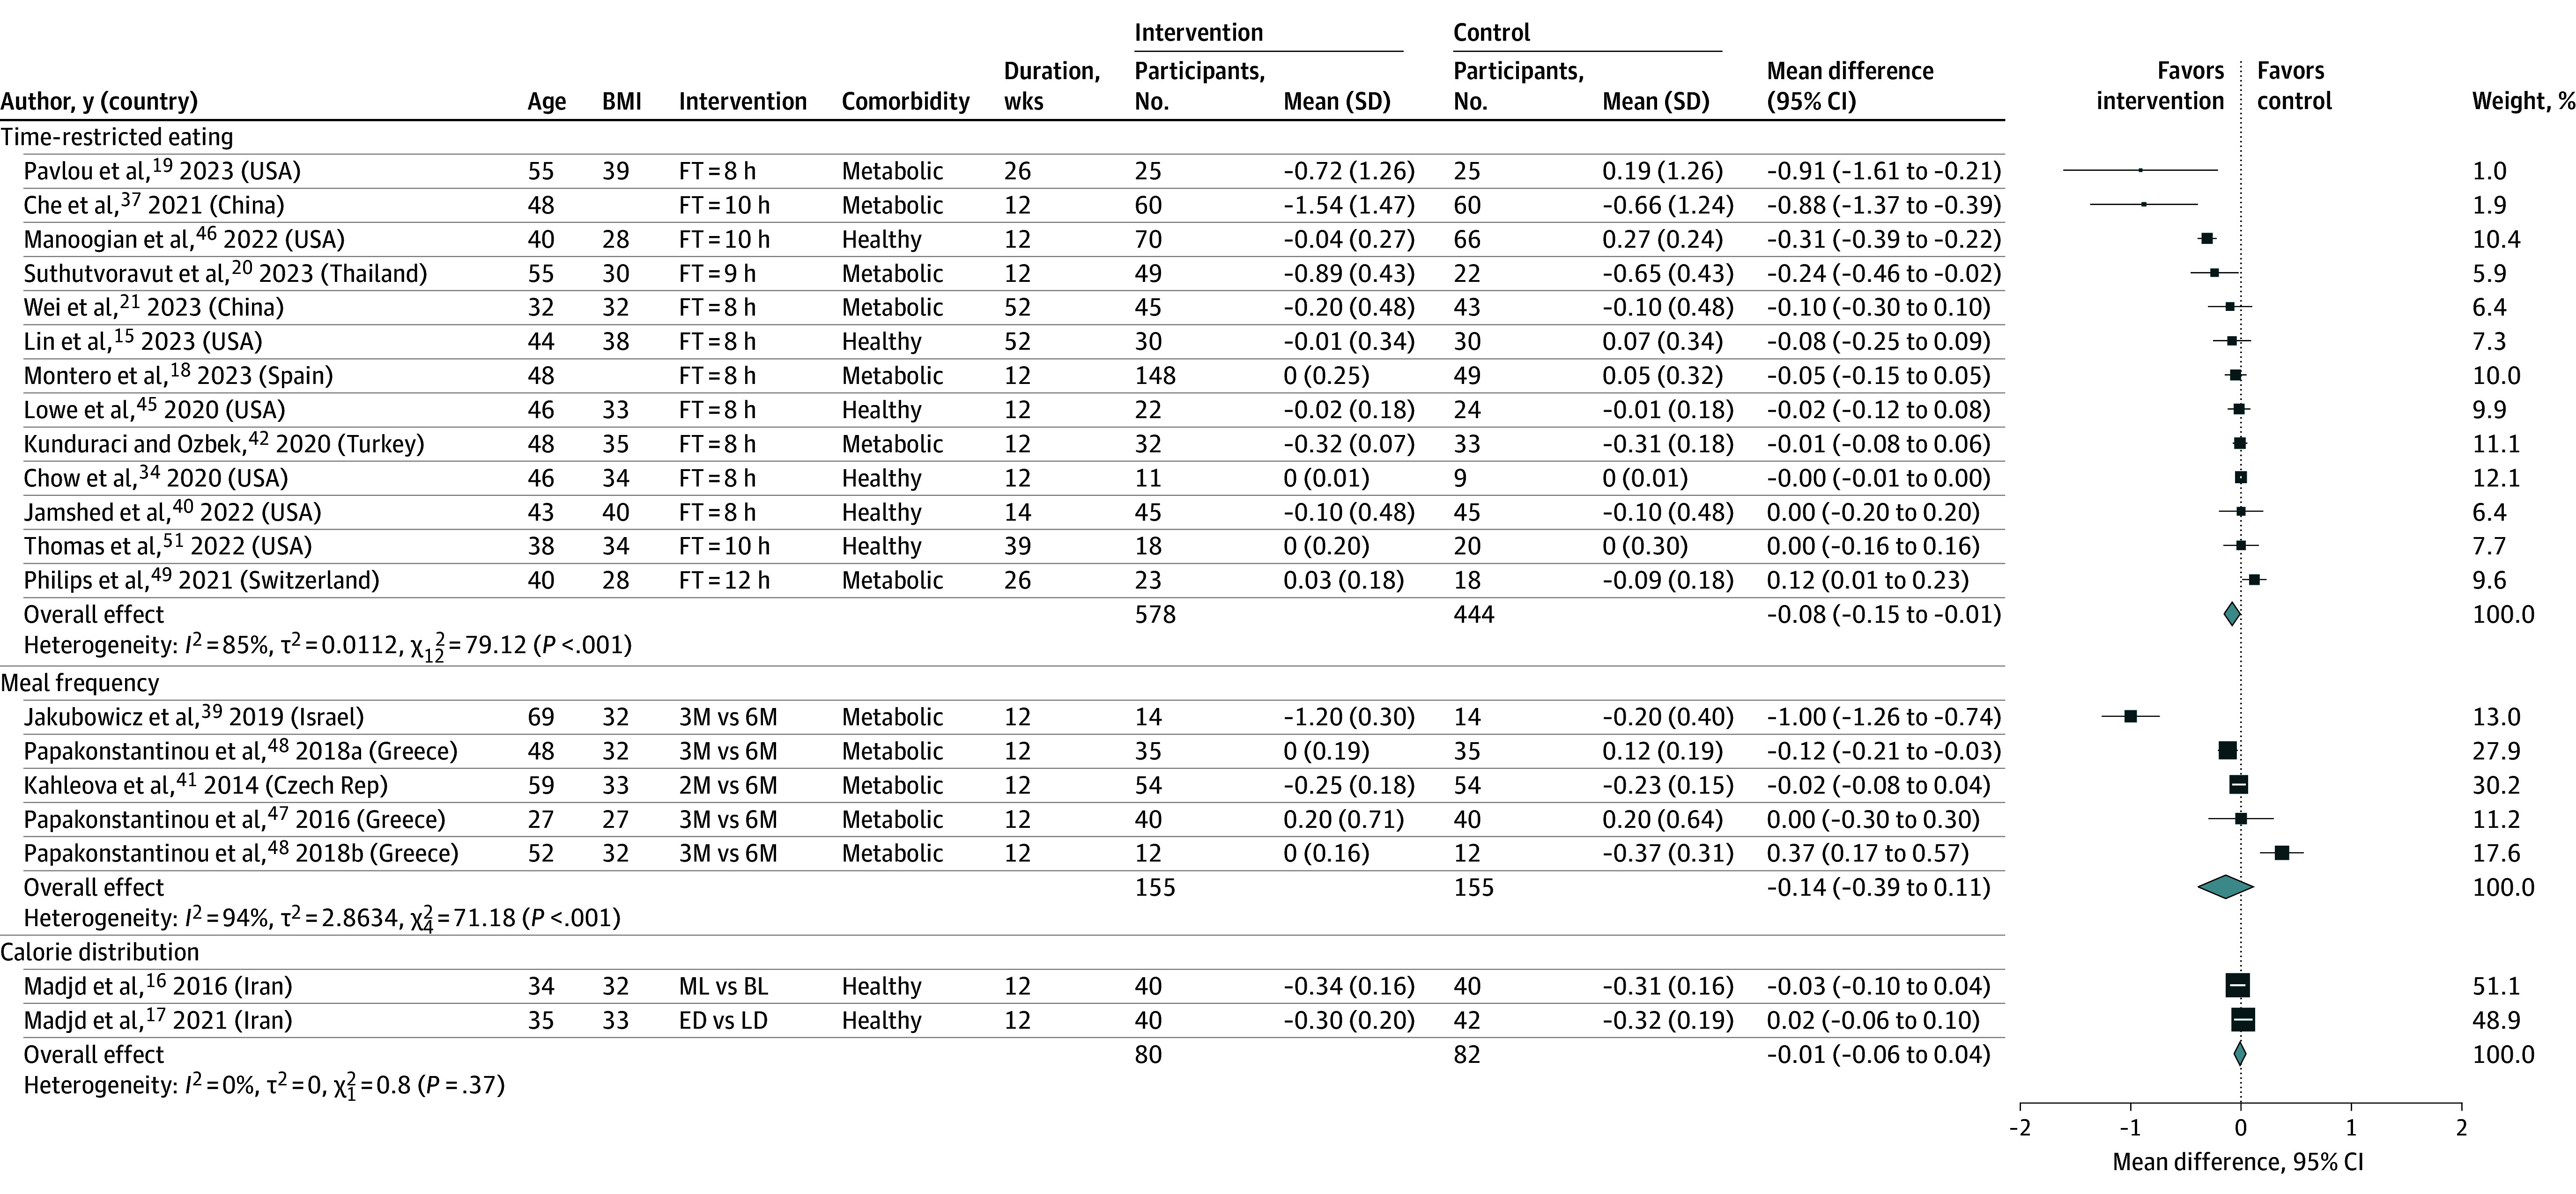
Figure 3. Meta-Analysis of Difference in Mean Difference (95% CIs) for the Effect of Meal Timing Interventions on HbA1c (%), Grouped by the Nature of the Meal Timing Intervention.

The forest plot shows effect estimates (squares) and 95% CIs (horizontal lines) for each randomized clinical trial (RCT). Larger squares indicate a larger weight has been assigned to that RCT. Left of the 0 line shows a finding in favor of interventions, whereas right of the 0 line shows a finding in favor of control. The diamond at the base of each plot demonstrates the pooled effect estimates and confidence intervals from all RCTs included in the meta-analysis. 2M/3M/6M indicates 2, 3, or 6 meals; BL, back loading (eating the heaviest/most calorie-dense meal toward the end of the day); BMI, body mass index (calculated as weight in kilograms divided by height in meters squared); ED, early dinner; FT, feeding time; duration, follow-up duration in weeks; LD, late dinner; ML, middle loading (having the most substantial/calorie-dense meal in the middle of the day, usually at lunch).
