
Fig. 6.
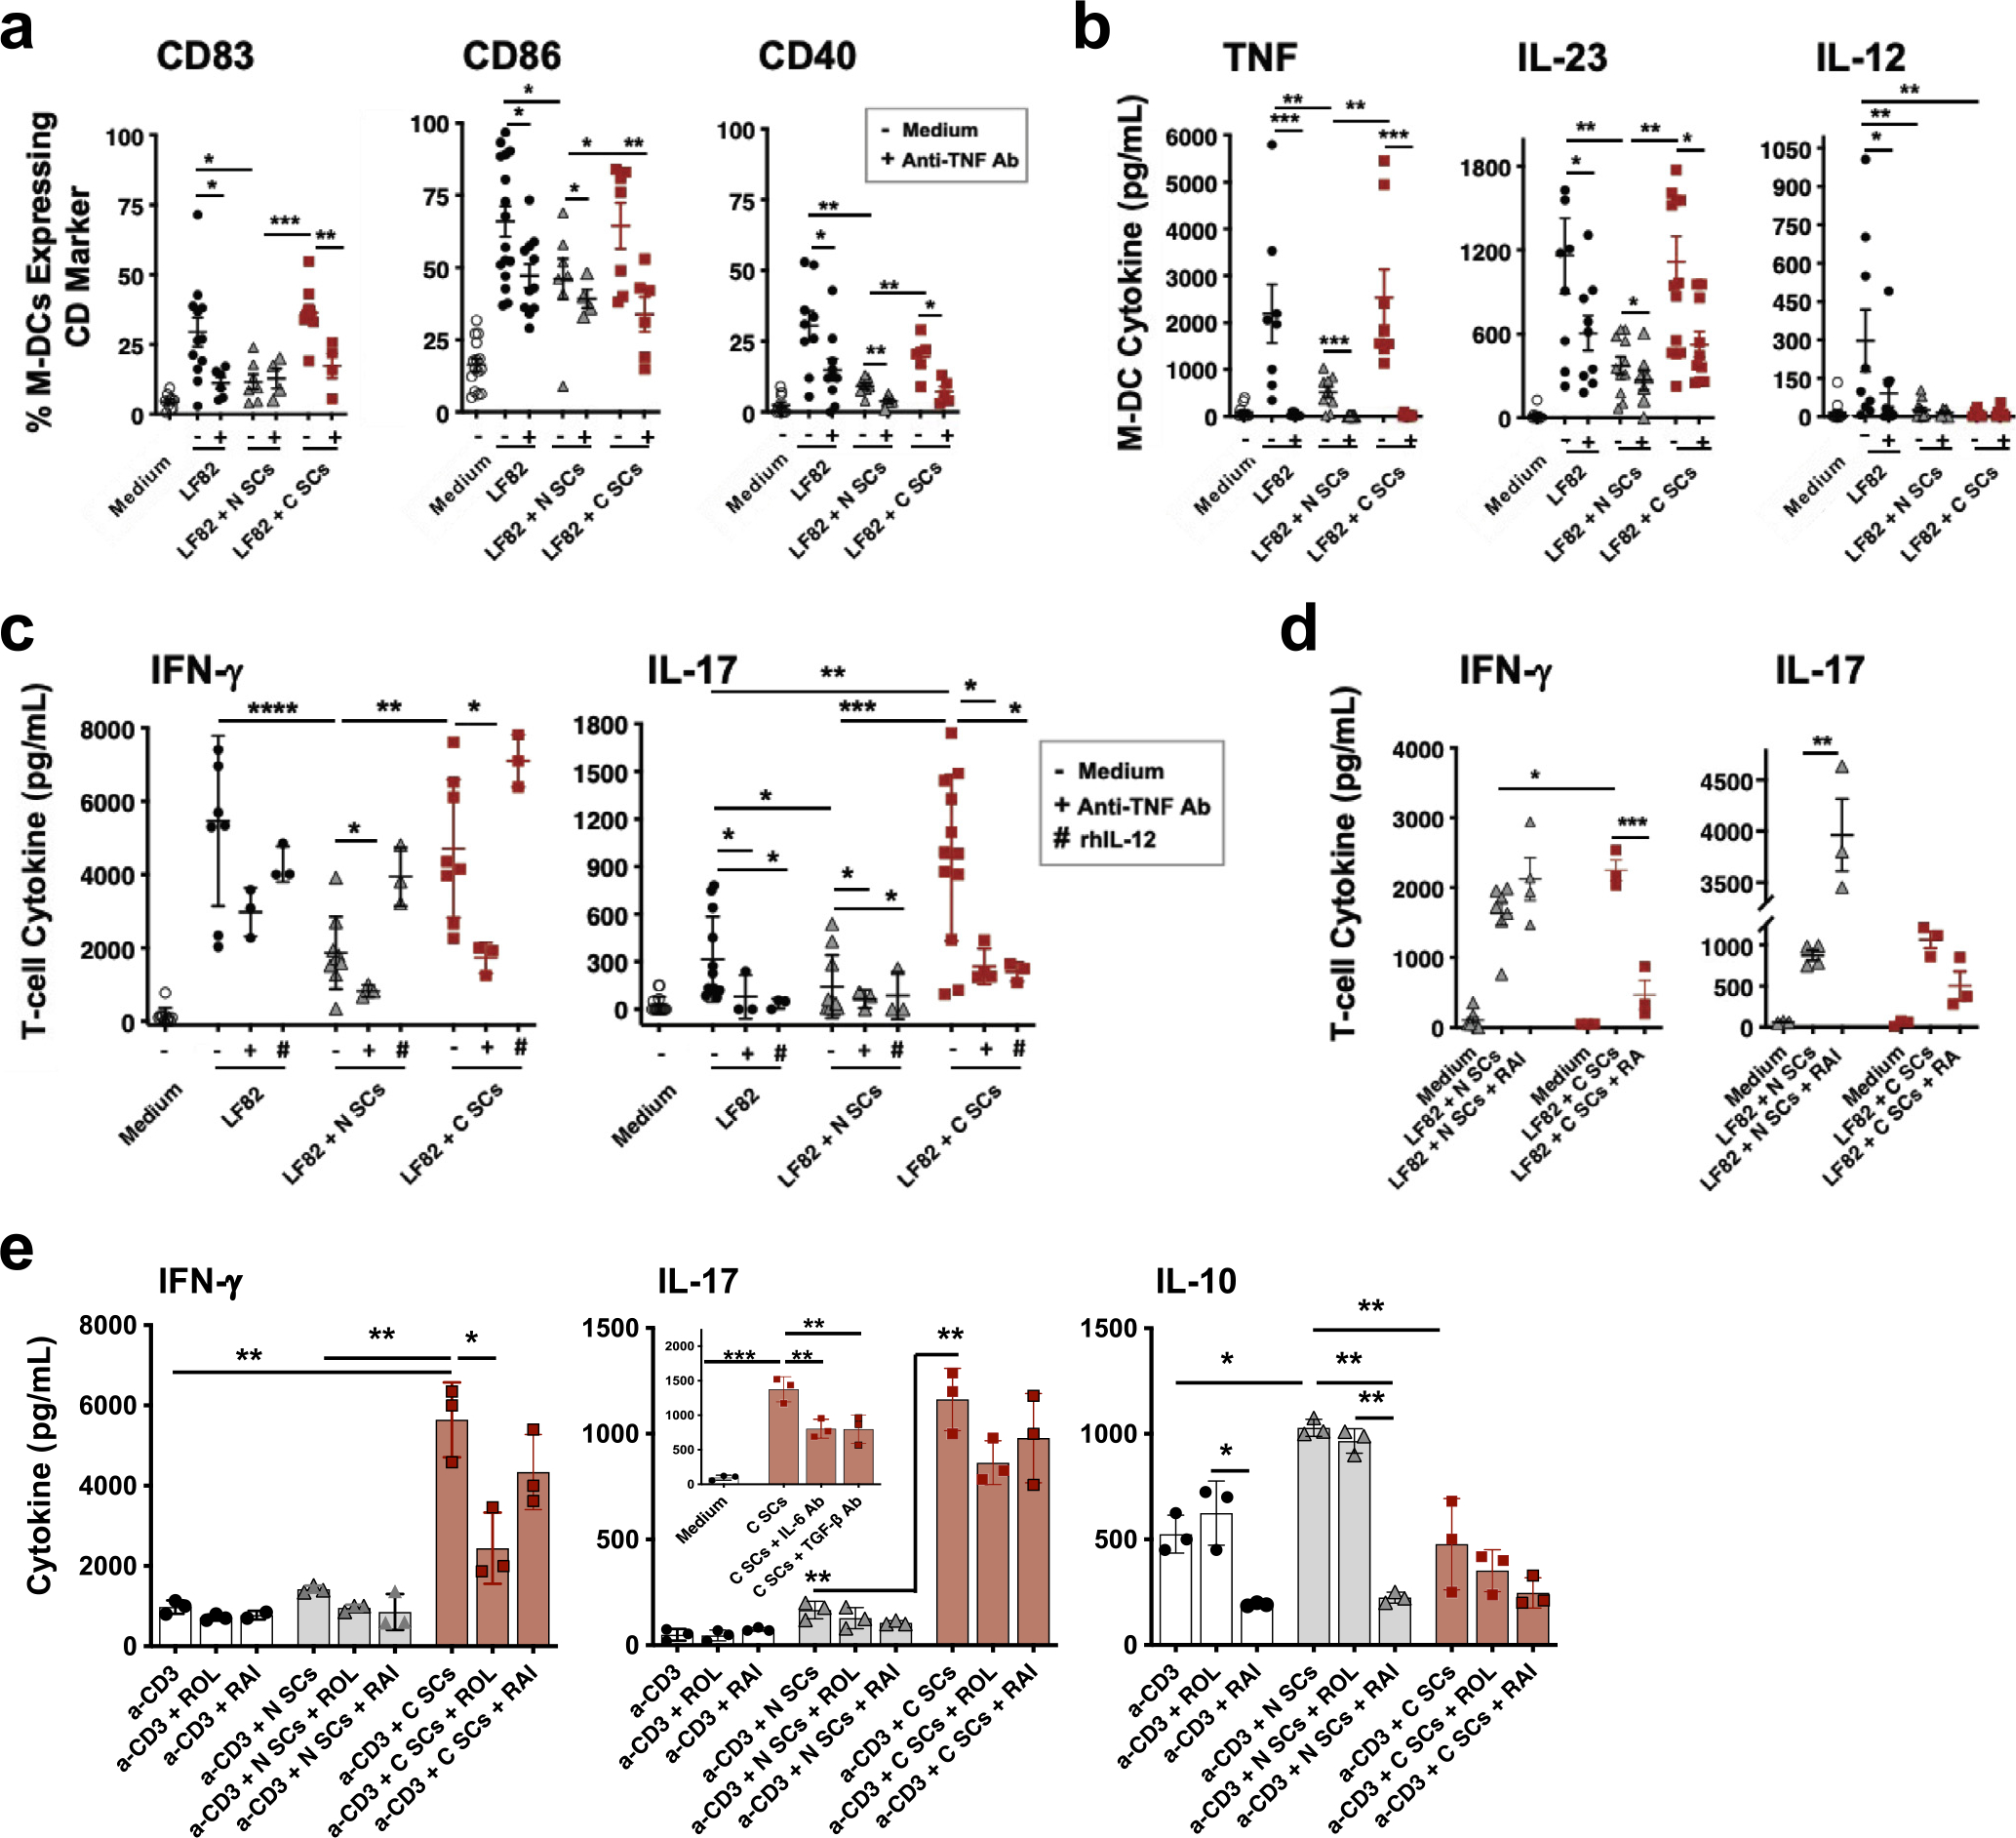
C SCs drive inflammatory M-DCs to induce a stronger inflammatory M-DC–T-cell response than N SCs. (A) Phenotype and (B) cytokine release of LF82-stimulated M-DCs differentiated in the presence of no SCs, N SCs, or C SCs and in the absence or presence of anti-TNF antibody (5 μg/mL, or antibody isotype, not shown) (n ≥ 7). (C) Cytokine release from co-cultures of LF82-stimulated M-DCs, differentiated in presence of medium alone or N SCs or C SCs, and syngeneic CD4+ T cells, in the absence or presence of anti-TNF antibody (5 μg/mL), rhIL-12 (5 ng/mL) (n ≥ 3), or (D) RAI (2 μM) or RA (100 nM) (n ≥ 3). (E) Cytokine (IFN-γ, IL-17 and IL-10) release from anti-CD3/CD28-stimulated CD4+ T cells cultured in the presence of no SCs, N SCs, or C SCs ± ROL (2 μM) or RAI (2 μM) (representative experiment from n = 4). Inset: IL-17 release from anti-CD3/CD28-stimulated T cells cultured with medium alone or C SCs ± neutralizing antibodies to IL-6 (5 μg/mL) or TGF-β (5 μg/mL) (n = 3). (Mean ± SEM; *p < 0.05, **p < 0.01, ***p < 0.001). C SCs = Crohn’s SCs; CD = cluster of differentiation; IFN = interferon; IL = interleukin; M-DC = monocyte-derived dendritic cell; N SCs = normal SCs; RA = retinoic acid; RAI = retinoic acid inhibitor; rhIL = recombinant interleukin; ROL = retinol; SC = stromal cell; SEM = standard error of the mean; TGF = transforming growth factor; TNF = tumor necrosis factor.