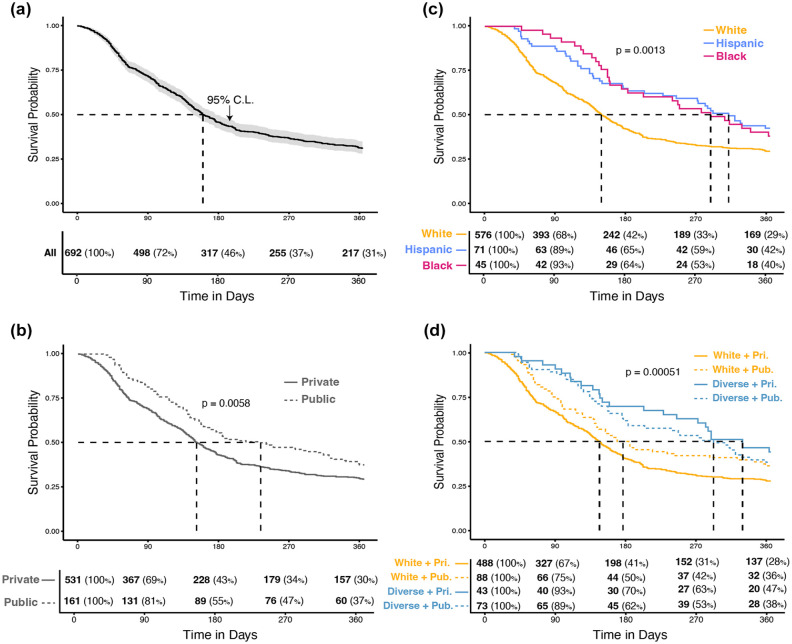
Figure 1.
Time to start of CGM use in year following diagnosis in pediatric T1D subjects. (a) Diagnosis cohort. (b) By race/ethnicity. (c) By insurance type. (d) By race/ethnicity and insurance type. Kaplan-Meir survival curves of time (days) from diagnosis with T1D to start of CGM as per clinical documentation. Dashed lines indicate median survival time for each group. The P values represent output from log-rank test of comparison between subgroup survival curves. Tables indicate number (%) of the subgroup that remains at risk of the outcome at specified time points. Cohort limited to subjects with race/ethnicity of white, Hispanic, or black (Other and Unknown categories excluded).
Abbreviations: T1D, type 1 diabetes; CI, confidence interval; White + Pri., white and private insurance; White + Pub., white and public insurance; Diverse + Pri., Hispanic or black and private insurance; Diverse + Pub., Hispanic or black and public insurance.

