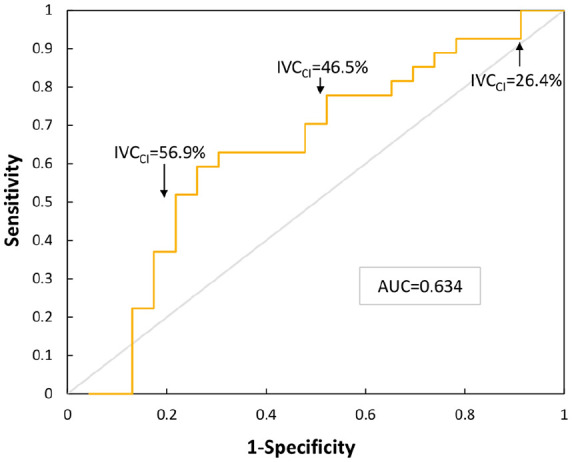
Figure 3.

This receiver-operating characteristic curve shows the change in sensitivity of IVC collapsibility for predicting hypotension as a function of 1 − specificity, or false-positive rate. Three IVC collapsibility values are provided for reference on the curve and the area under the curve (AUC) is provided.
