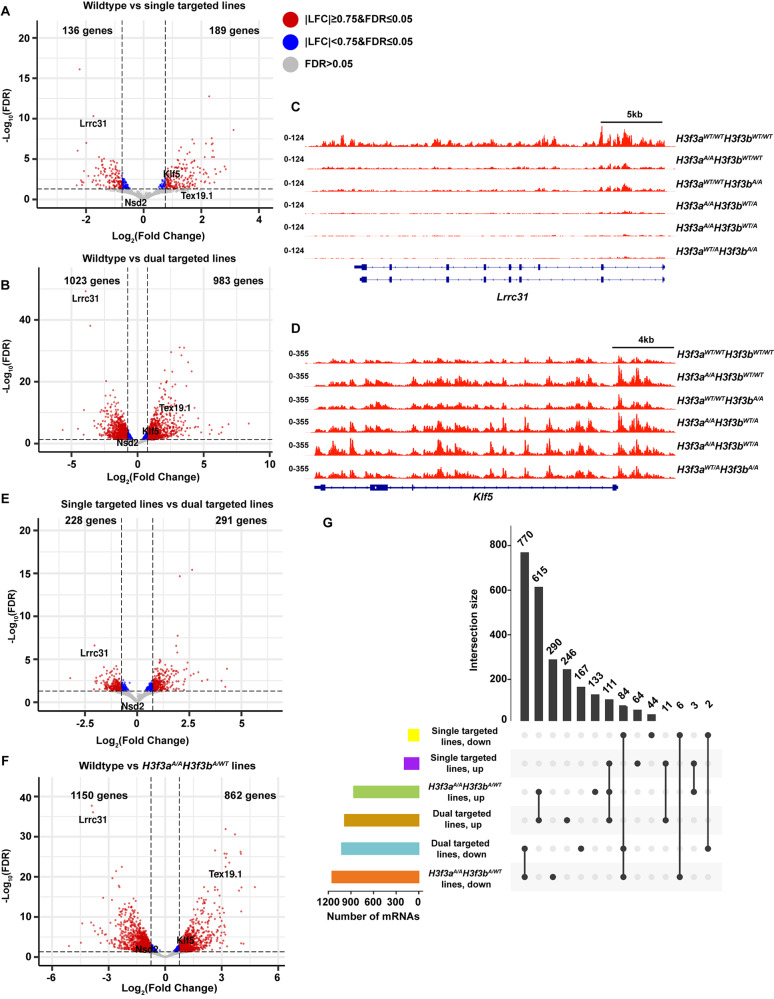
Fig. 4.
H3.3K122A results in transcriptomic changes in mES cells. A. Volcano plot of differentially transcribed genes in single targeted H3.3K122A cells (H3f3aA/AH3f3bWT/WT and H3f3aWT/WTH3f3bA/A, n = 2) relative to wildtype (n = 3). Red points are genes |LFC|≥0.75 and FDR ≤ 0.05, blue points are genes |LFC|<0.75 and FDR ≤ 0.05, and grey points are not significantly changed. B. As in A, for dual targeted lines (H3f3aA/AH3f3bA/WT and H3f3aA/WTH3f3bA/A, n = 3) relative to wildtype (n = 3). C. Browser track of nascent RNA-seq (TT-seq) from H3.3K122A cell lines and wildtype cells over the Lrrc31 locus. D. As in E, for the Klf5 locus. E. As in A, for dual targeted (n = 3) relative to single targeted cell lines (n = 2). F. As in A, for H3f3aA/AH3f3bA/WT lines (n = 2) relative to wildtype (n = 3). G. Upset plot showing the number of differentially transcribed genes (log2(FC) ≥ 0.75 and FDR ≤ 0.05) shared between genotypes (upper bar graph, black) and the overall number of differentially transcribed genes in each genotype (lower left bar graph)

