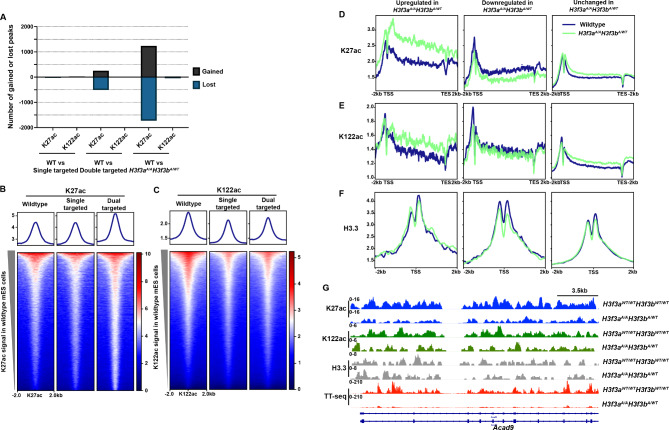
Fig. 5.
H3f3aA/AH3f3bA/WT cell lines exhibit altered patterns of K27ac enrichment relative to wildtype mES cells. A. Bar graph depicting the number of differentially enriched K27ac or K122ac CUT&RUN peaks (|LFC|≥0.5 and FDR ≤ 0.05) for the indicated cell line comparisons. B. Enrichment of K27ac CUT&RUN signal in average wildtype (n = 2), single targeted (n = 2), and dual targeted cell lines (n = 3) over K27ac consensus peaks (this study). C. Enrichment of K122ac CUT&RUN signal over average wildtype (n = 2), single targeted (n = 2), and dual targeted cell lines (n = 3) over K122ac consensus peaks called using previously published H3K122ac ChIP-seq data [26]. D. Metaplots of K27ac enrichment over genes upregulated, downregulated, or unchanged in H3f3aA/AH3f3bA/WT cell lines. E. As in D, for K122ac enrichment. F. As in D, for H3.3 enrichment. G. Browser track showing replicate averaged enrichment of K27ac (blue), K122ac (green), H3.3 (grey), and sense nascent transcription (red) over the 5’ end of the Acad9 locus in H3f3aA/AH3f3bA/WT and wildtype mES cells

