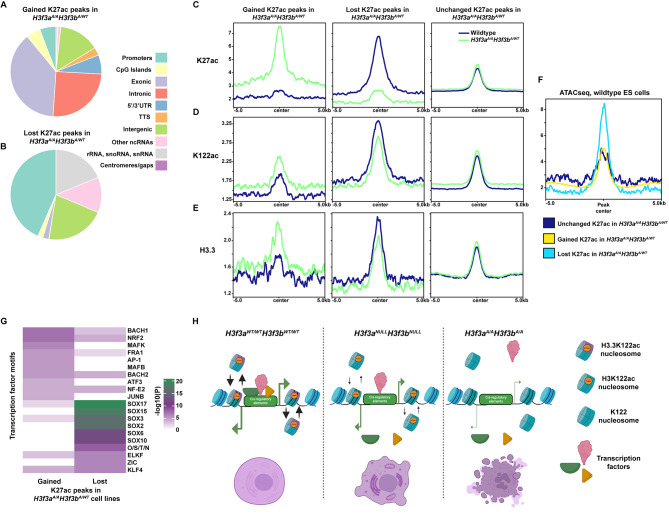
Fig. 6.
H3 and H3.3 acetylation dynamics at putative enhancers in targeted and wildtype mES cells. A. Pie chart of the HOMER annotation of gained K27ac peaks in H3f3aA/AH3f3bA/WT mES cells relative to wildtype. Each color corresponds to a genomic feature denoted in the legend (right). B. As in A, for lost K27ac peaks in H3f3aA/AH3f3bA/WT mES cells relative to wildtype. C. K27ac enrichment in wildtype and H3f3aA/AH3f3bA/WT mES cells over gained, lost, and unchanged TSS distal H3K27ac peaks from H3f3aA/AH3f3bA/WT mES cell. D. As in C, for K122ac enrichment. E. As in C, for H3.3 enrichment. F. Wildtype mES cell ATAC-seq signal over gained, lost, and unchanged TSS distal H3K27ac peaks from H3f3aA/AH3f3bA/WT mES cells. G. Top 10 most enriched TF motifs found at TSS distal H3K27ac peaks gained or lost in H3f3aA/AH3f3bA/WT mES cells relative to wildtype. Color indicates -log10(P) as defined by HOMER. H. Model for how H3.3K122A may result in lethality in mES cells

