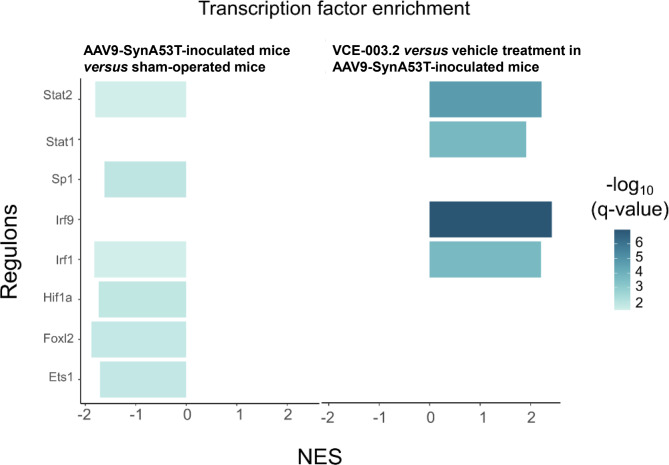
Fig. 7.
Transcription factor enrichment analysis using DoRothEA showing the altered regulons that were significant at q-value < 0.05. X-axis shows the directionality and Y-axis the different regulons, with the green color tone reflecting the levels of significance. The significant enrichment for the comparison of AAV9-SynA53T-injected mice versus sham-operated mice, both treated with vehicle, is presented on the left, whereas the one for the comparison of VCE-003.2-treated AAV9-SynA53T-injected mice versus those treated with vehicle is presented on the right

