
Fig. 2. Sensor-level analysis of oscillatory responses.
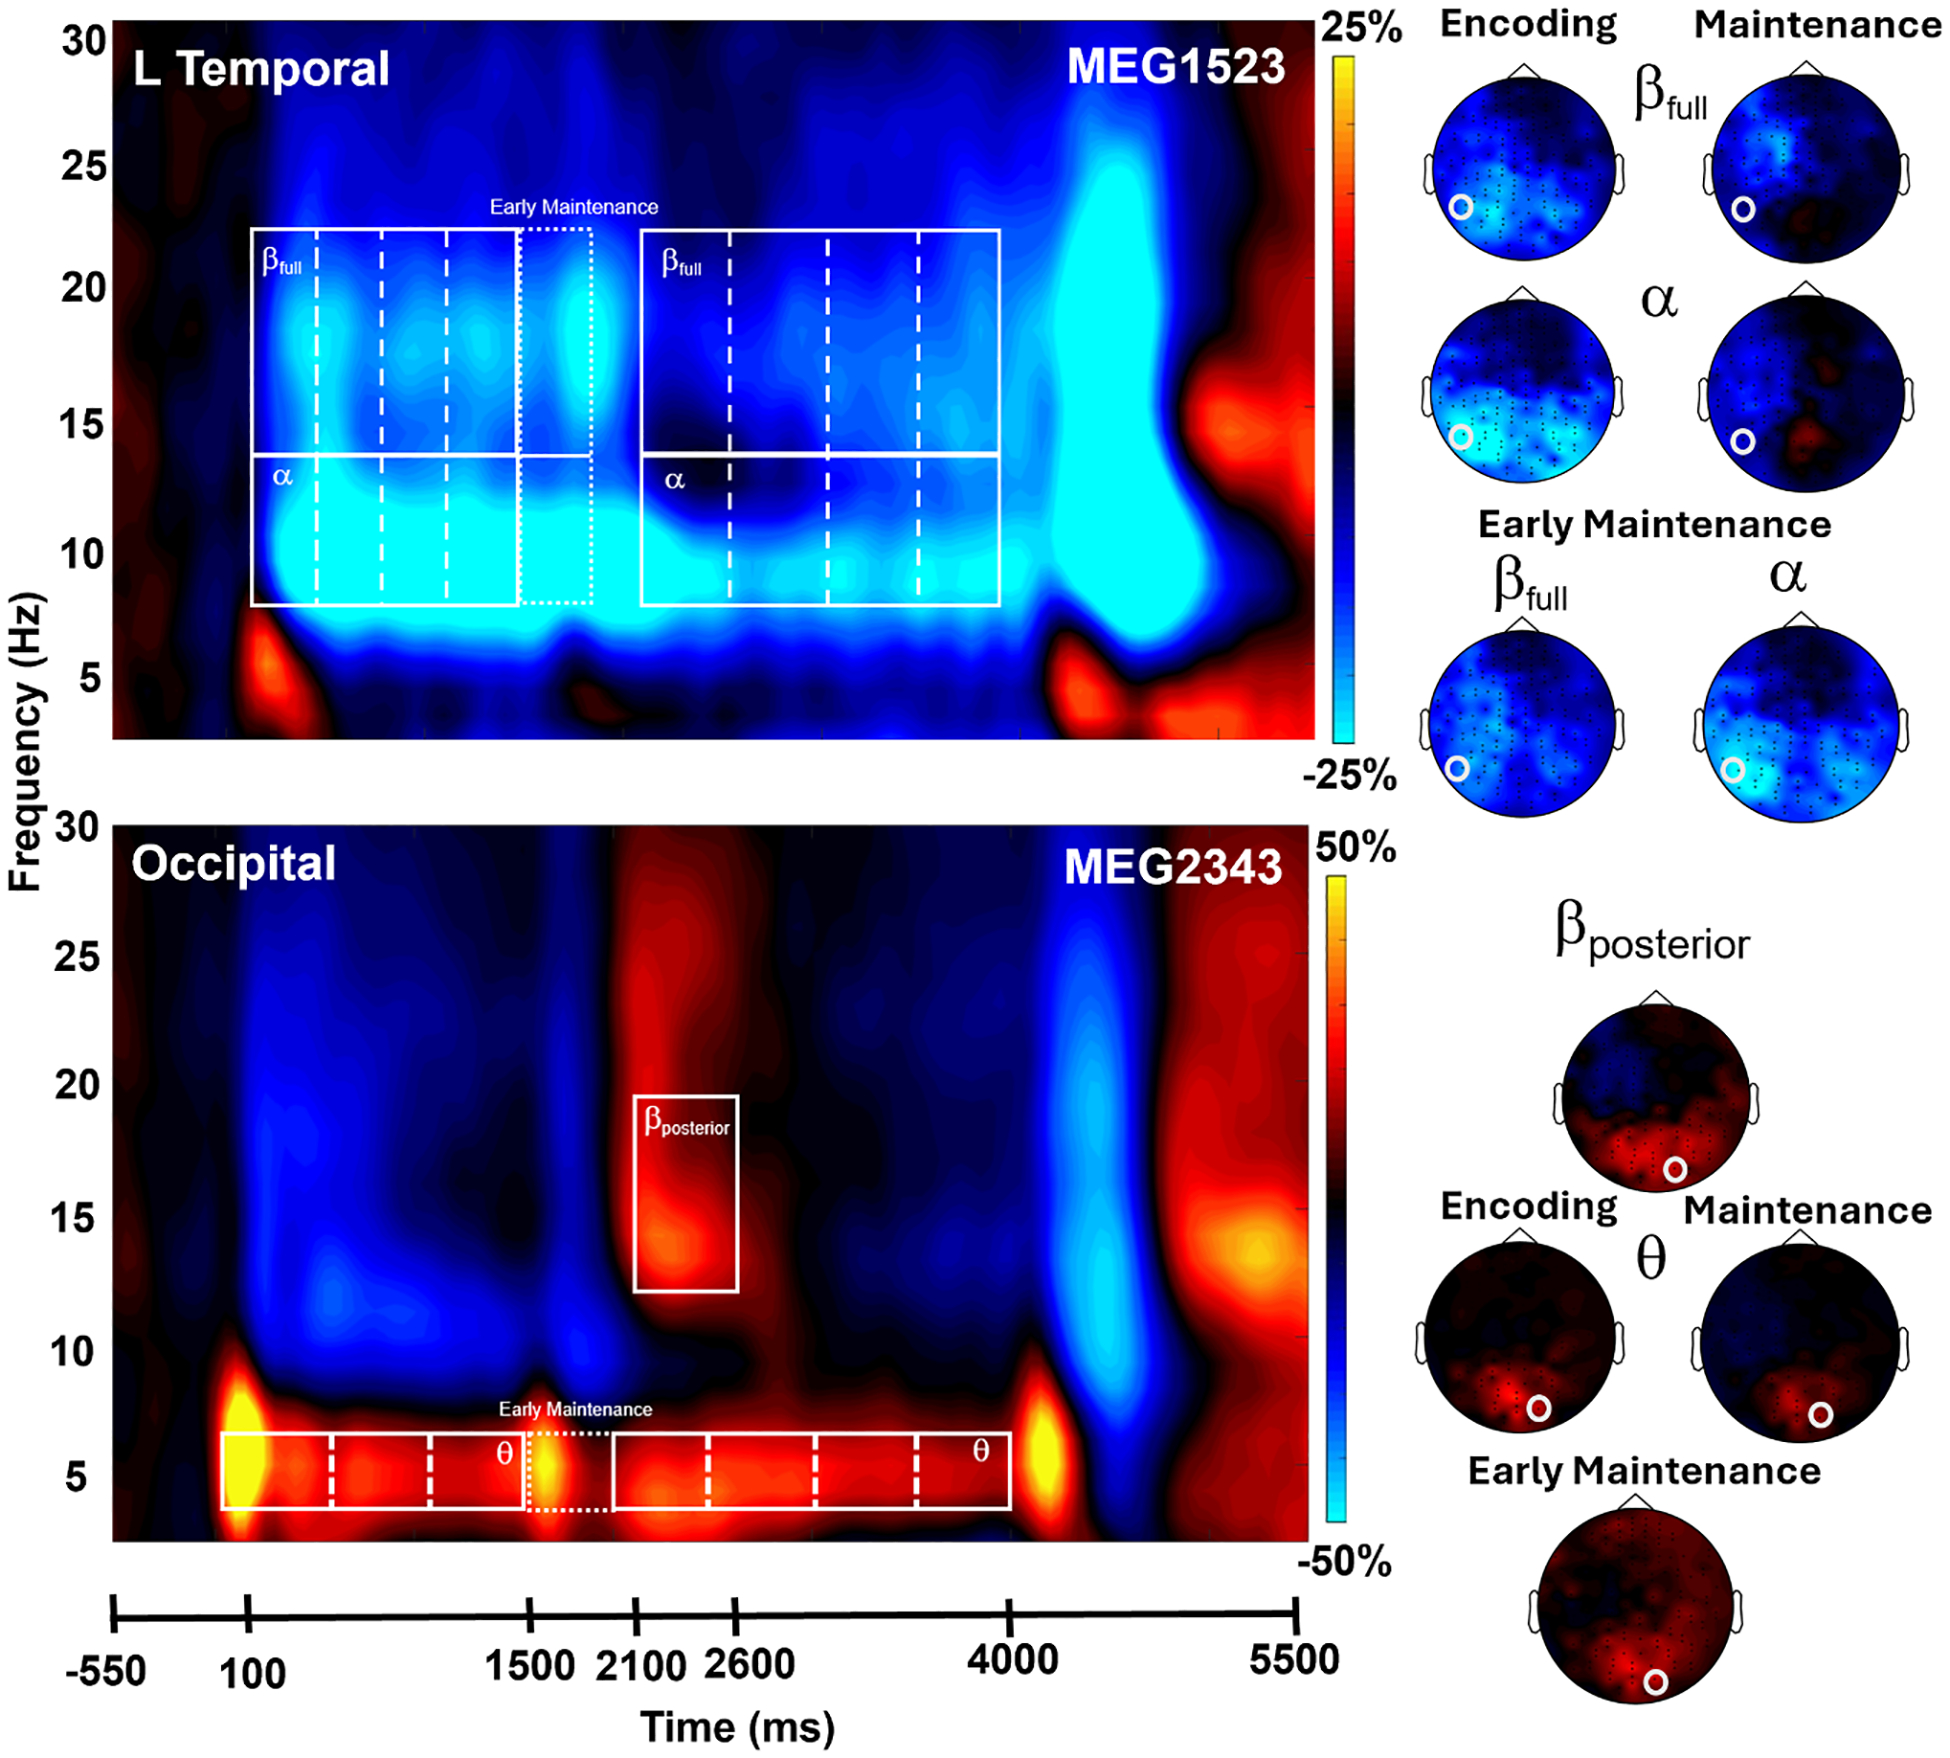
MEG time-frequency spectrograms with time (ms) on the x-axis and frequency (Hz) on the y-axis. The onset of the encoding grid occurred at 0 ms. Power is shown in percent change units relative to the baseline period (−550 to −50 ms). Data has been averaged across all trials and all participants in both the high-distraction and low-distraction conditions. Top panel: Sustained decreases in the alpha (8–14 Hz) and beta (βfull: 14–23 Hz) spectral bands were observed near left frontal and temporal sensors. Bottom panel: Increases in the theta (3–6 Hz) and posterior beta (βposterior: 12–18 Hz) range were observed in sensors near the occipital cortex. White boxes denote the time-frequency windows used for source-space analyses. These time-frequency windows were statistically significant (p < .001, corrected) in the sensor level analyses. Right: 2D topographical maps were computed for each oscillatory response window. Note that these have been averaged across time windows comprising the extended encoding and maintenance responses in alpha, beta, and theta. The white circles mark the location of the sensors displayed in each spectrogram.