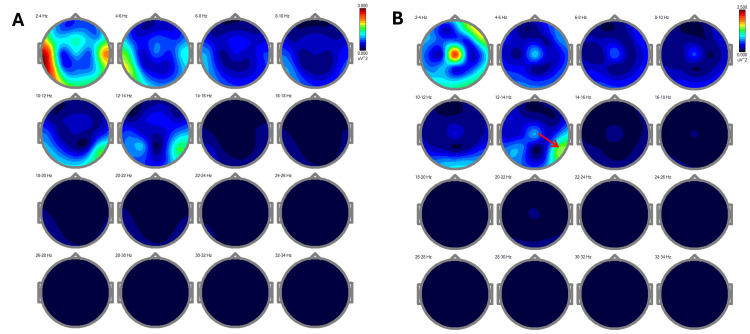
Figure 2. Frequency maps of EEG power spectra across different bands.
Figure 2A: Fragment: eyes closed at 17:36:48, offset: 0.00 s, length: 299.98 s, number of epochs: 144. Notable presence of delta rhythm in the temporal and mid-frontal regions.
Figure 2B: Significant reduction of slow rhythms in the temporal areas. The red arrow highlights the rapid alpha rhythm.
Note: Frequencies in the 2-4 Hz range are artifacts from eye movement and the Cz channel.
EEG: electroencephalography

