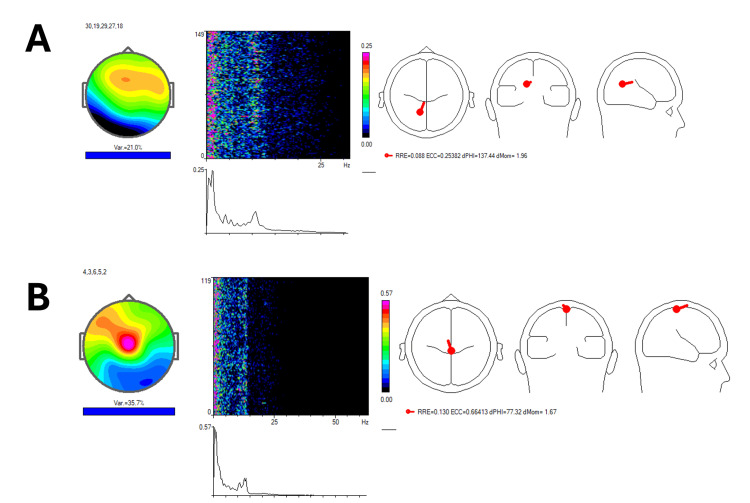
Figure 3. Independent component analysis with winEEG.
Figure 3A displays pre-treatment frequency peaks between 1.95 Hz and 10.74-12.45 Hz, highlighting a restricted range of brain wave activity.
Figure 3B shows post-treatment frequency peaks extending up to 13.43 Hz, indicating a more dynamic and integrated brain wave activity pattern.

