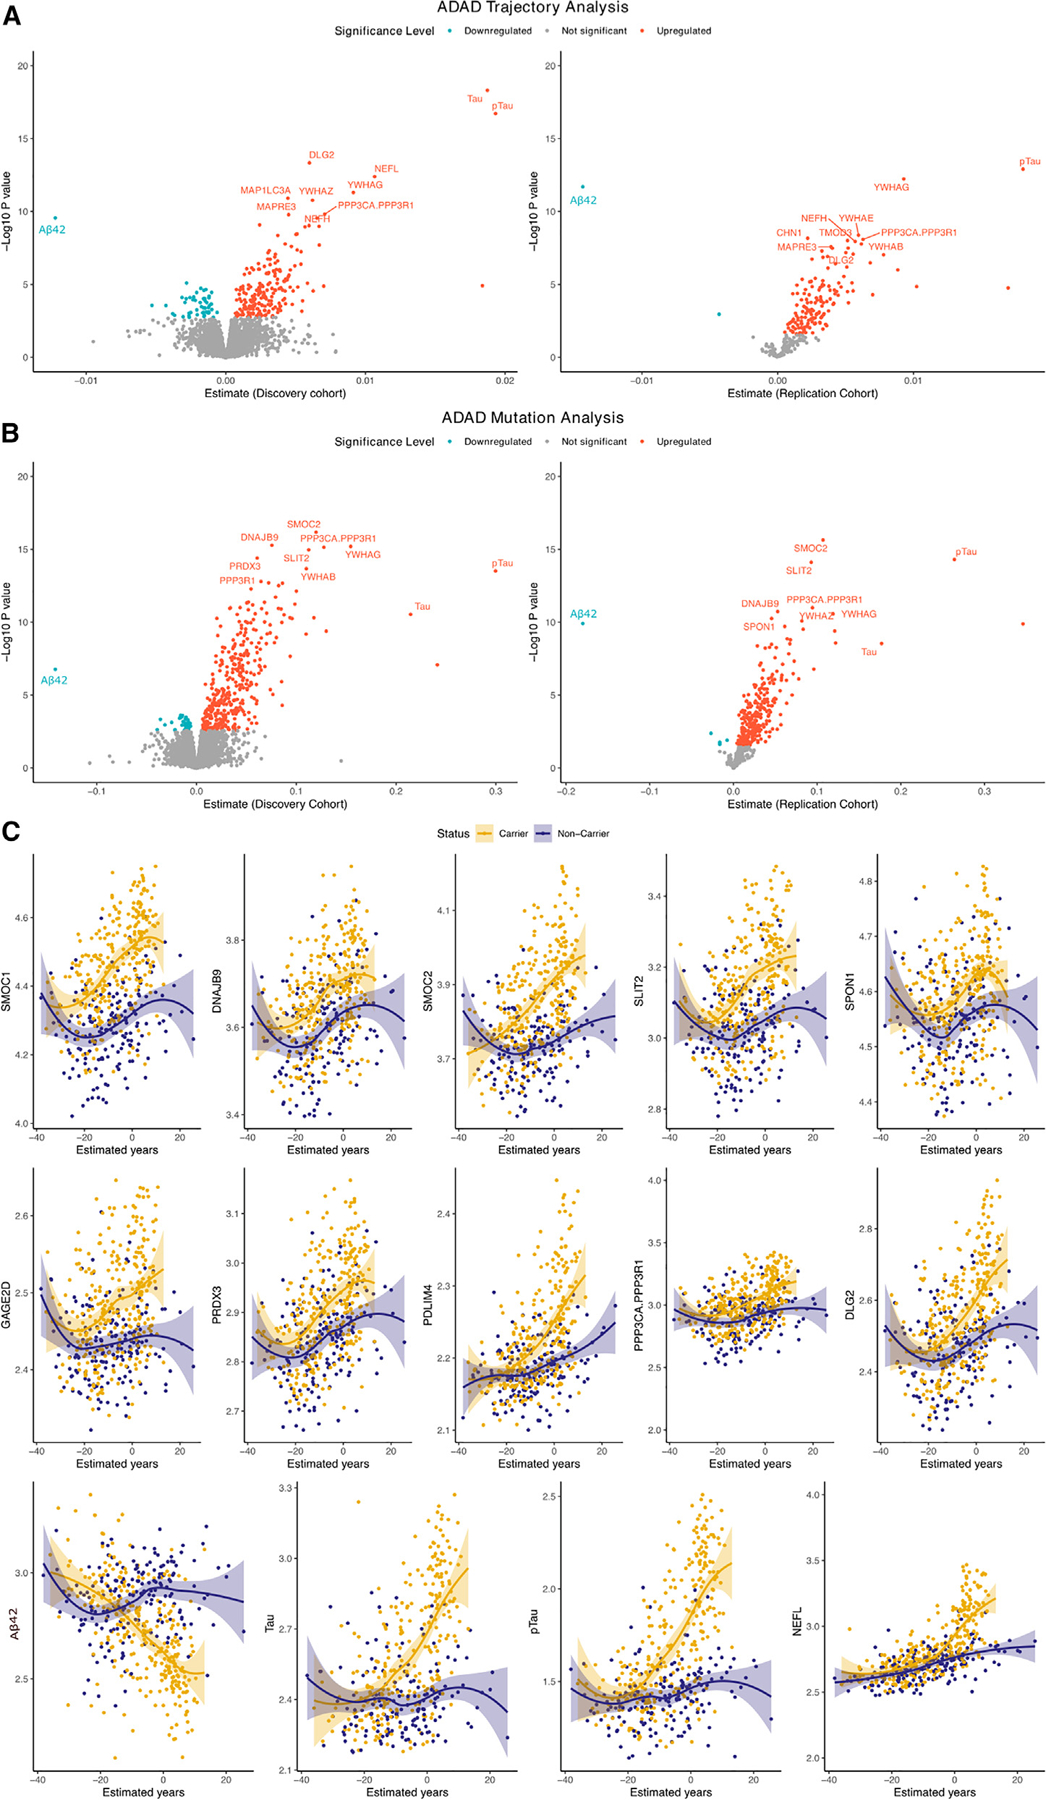
Figure 2. Significant pseudo-trajectory proteins and significant proteins associated with ADAD mutation status in CSF.

(A and B) Volcano plots displaying the estimate change (x axis) against −log10 statistical differences (y axis) for all tested proteins for pseudo-trajectory analyses between MCs and NCs (A) and ADAD mutation status only (B). The red dots show the significantly upregulated proteins, and the blue dots show the significantly downregulated proteins after multiple test correction (FDR p value < 0.05).
(C) Twelve significant pseudo-trajectory proteins that changed earlier than Tau, pTau, and Aβ42.
