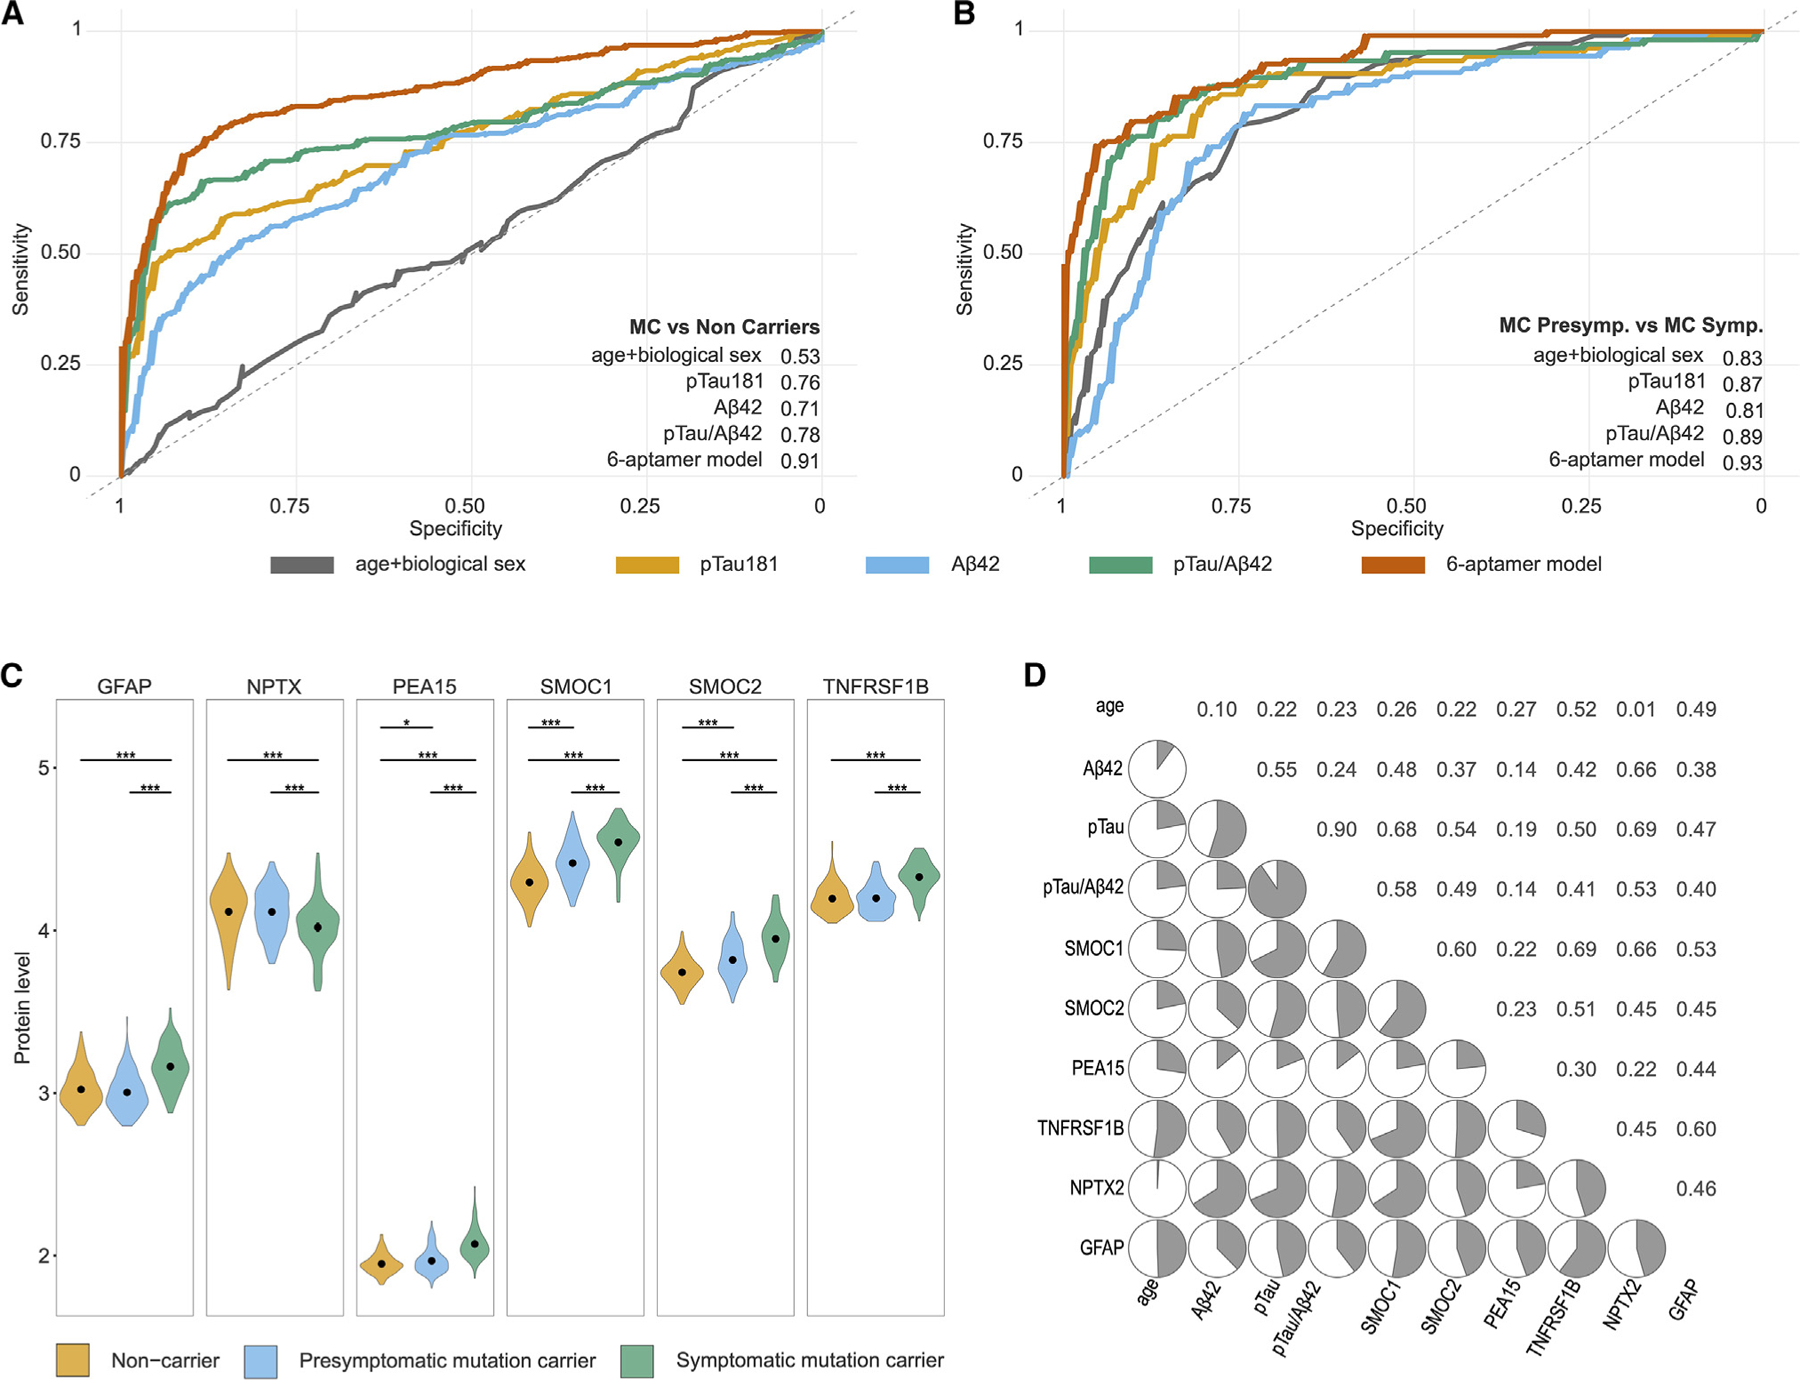
Figure 5. Predictive models for ADAD.

(A and B) The ROC and AUC corresponding to the final protein signature fitted into a generalized linear model (GLM) model, compared with the predictive power of age and sex; β-amyloid 42, pTau 181, and the pTau181/Abeta42 ratio in predicting mutation carriers compared with non-carriers (A); and symptomatic mutation carriers compared with non-symptomatic mutation carriers (B).
(C) Violin plots comparing the levels of the six proteins included in the predictive model in non-carriers, non-symptomatic carriers, and symptomatic carriers. Gray dots with extended lines in each violin plot represent the median ± SD. * represents level of p value significance. ***p < 0.001; **p < 0.01; *p < 0.05; ns = not significant.
(D) Correlation matrix corresponding to the Spearman correlations for the six proteins included in the predictive models, age, β-amyloid 42, pTau 181, and the pTau181/ABeta42 ratio in non-carriers.
