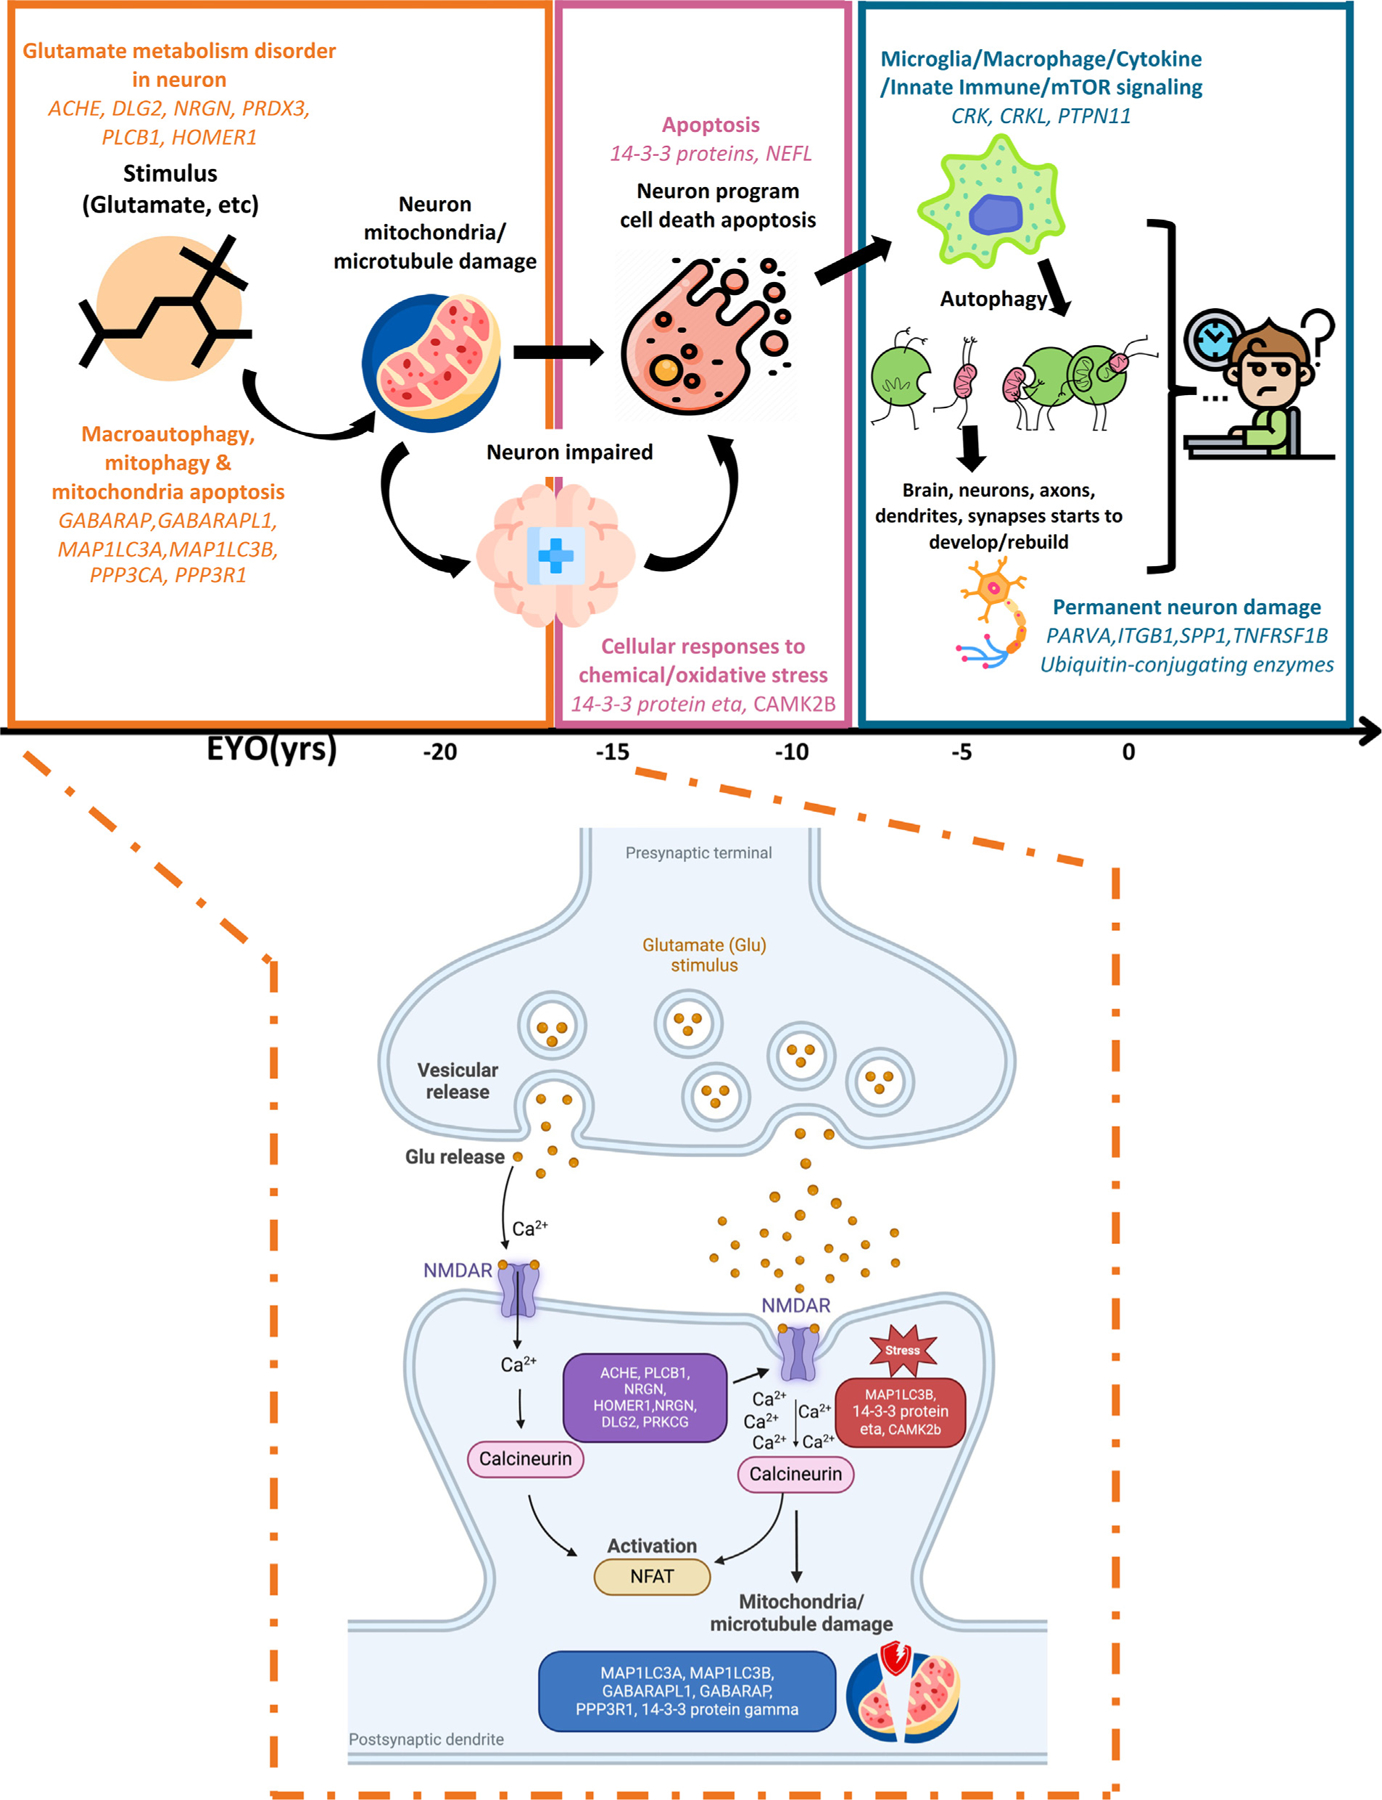
Figure 6. Multiple biological process trajectories’ summary.

Highlighted pathology process and enriched significant trajectory proteins in each module by chronological order and highlighted biological process of early stage of ADAD (M1). It includes normal state and early ADAD disease stage. x axis represents the EYO in years.
