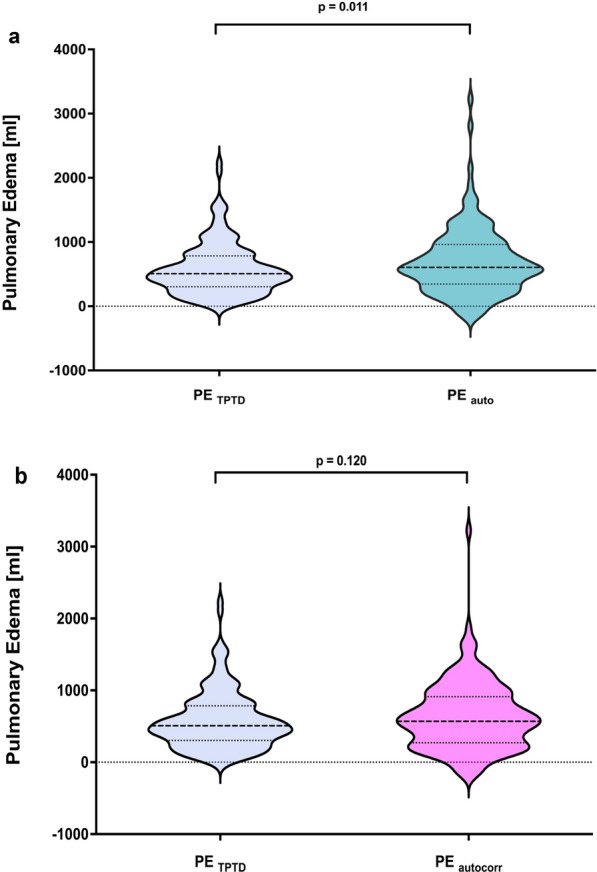
Fig. 1.

Pulmonary edema in patients with moderate-to-severe ARDS. Violin plots comparing pulmonary edema quantified using TPTD (blue) to a automated segmented CT scans automated (turquoise) and to b automated segmented CT scans using local voxel density analysis and excluding contrast agent (magenta). Data distribution is represented by the violin plot with solid and dotted lines showing the median and interquartile range, respectively. Brackets denote statistical analysis between measurement modalities. Statistical analysis was performed using Student’s t test. CT: computed tomography; PE: pulmonary edema; TPTD: transpulmonary thermodilution
