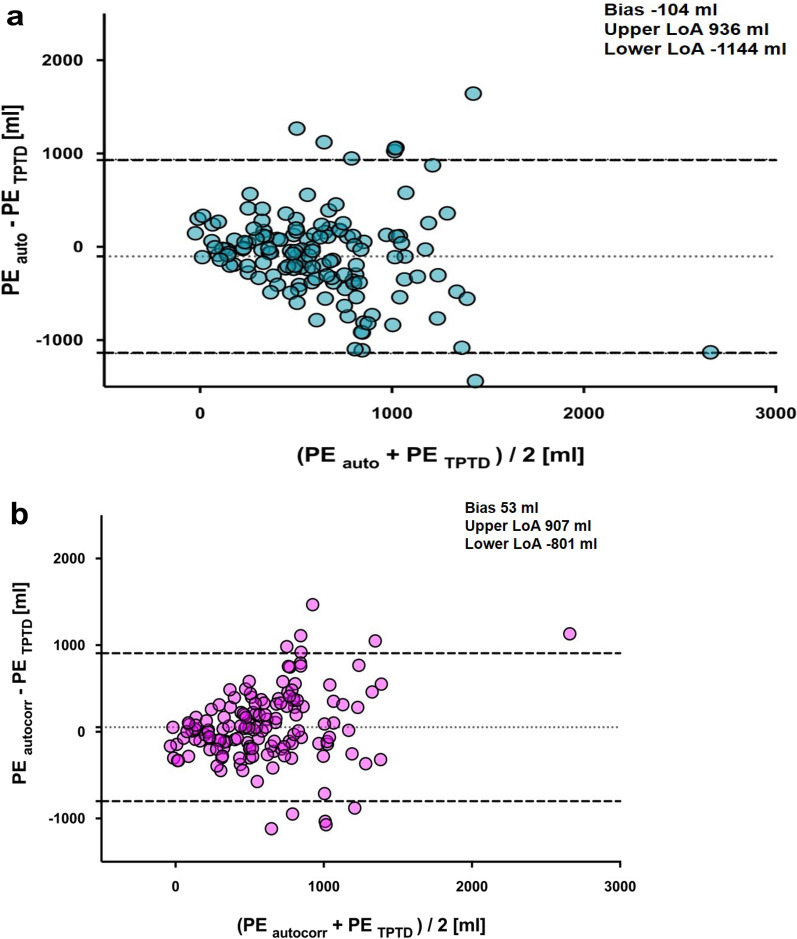
Fig. 3.
Bland–Altman plot of pulmonary edema measured by a automated segmentation (blue circles) and b automated segmentation using local voxel density analysis and excluding contrast agent (magenta circles) compared with transpulmonary thermodilution. Data are shown as the mean between pulmonary edema measured by CT scan and transpulmonary thermodilution plotted against the difference of both measurements. Dotted lines show bias, dashed lines the upper and lower levels of agreement. CT: Computed tomography; LoA: Limit of agreements; TPTD: transpulmonary thermodilution

