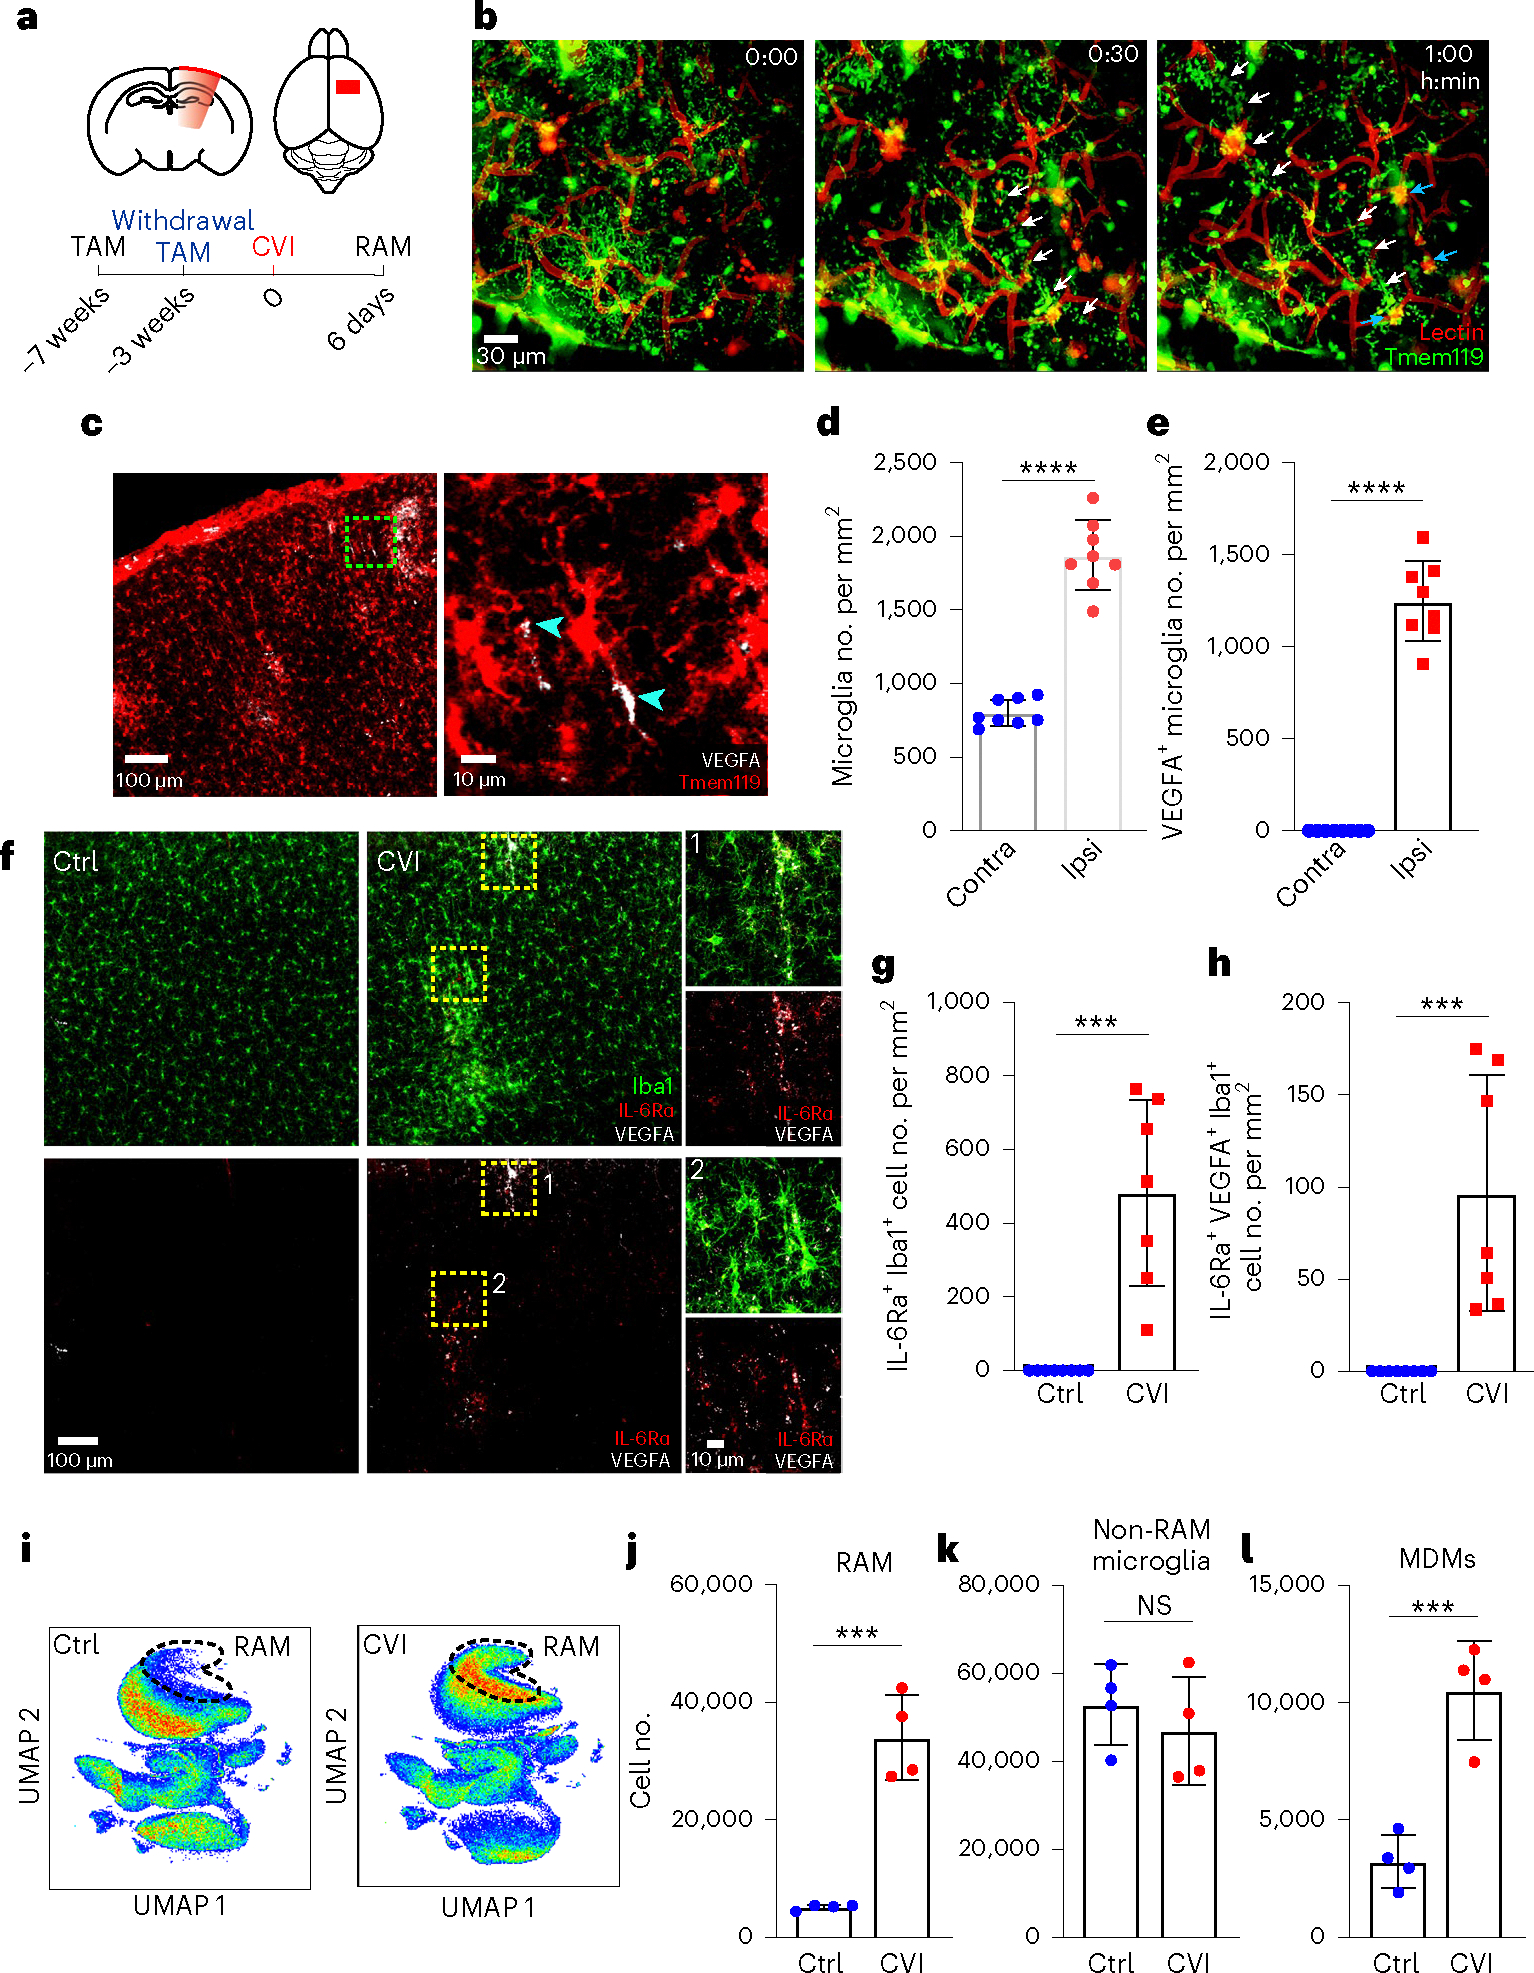
Fig. 1 |. CVI induces RAM generation.

a, Schematic representation of CVI induction (red) in the mouse brain from a coronal (top left) and axial (top right) view. The timeline shows when tamoxifen (TAM) chow was administered and withdrawn in relation to CVI and RAM analysis. b, Time-lapse images from a Tmem119-TdTo mouse (n = 4) imaged by TPM through a thinned-skull window showing the acute microglial response to a CVI. Fluorescent tomato lectin (red, pseudocolored) was injected i.v. to visualize vessels and extravasated material from the blood. Microglia (green, pseudocolored) rapidly extended processes toward a damaged vessel (white arrowheads) and interacted with extravasated, lectin-derived material within minutes post-CVI (cyan arrowheads). The data represent two independent experiments (see Supplementary Video 1). c, Immunofluorescent staining for VEGFA (white) in the neocortex of a Tmem119-TdTo mouse on day 6 post-CVI. The magnified image in the right panel is denoted by a dotted green box in the left panel. Microglia (red) express VEGFA in their cell bodies and distal processes (cyan arrowheads). d,e, Bar graphs show the number of microglia (d) and VEGFA-expressing microglia (e) in the injured ipsilateral (Ipsi) versus uninjured contralateral (Contra) hemisphere at day 6 post-CVI in Tmem119-TdTo mice (n = 8). Combined data from two independent experiments are shown in c–e. f, Immunofluorescent staining for IL-6Ra (red), VEGFA (white) and Iba1 (green) in the neocortex of B6 mice on day 6 post-CVI relative to uninjured controls (Ctrl). CVI induced IL-6Ra expression in microglia, some of which coexpressed VEGFA (yellow boxes 1 and 2). Boxed areas are enlarged on the far right. g,h, Bar graphs depicting quantification of IL-6Ra+ (g) and IL-6Ra+VEGFA+ (h) microglia in uninjured Ctrl (n = 8) versus CVI (n = 7) mice. Combined data from two independent experiments are shown in f–h. i, UMAP plots showing high-parameter flow cytometry data of leukocytes extracted from punch-biopsied brains of injured (n = 4) versus uninjured (Ctrl, n = 4) Tmem119-TdTo mice at day 6 post-CVI. Dashed lines delineate RAMs based on the expression of markers identified using Cluster Explorer (see Extended Data Fig. 1k). j–l, Bar graphs showing the absolute number of RAMs (TdTo+VEGFA+IL-6Ra+CD24+CD44+CD206+CD11c+Ly6clo/intMHCIIloCX3CR1+CD11b+CD45lo/int) (j), non-RAMs (TdTo+VEGFA−IL-6Ra−CD24−CD44−CD206−CD11c−Ly6c−MHCIIloCX3C R1+CD11b+CD45lo) (k) and MDMs (TdTo−CD24+CD44+CD206+CD11c+Ly6c+CX3CR 1+CD11b+CD45+) (l) for the groups denoted in i. Data represent two independent experiments. All graphs show mean ± s.e.m. and dots represent individual mice. ***P < 0.0005, ****P < 0.0001; two-tailed, unpaired Student’s t-test. NS, not significant.
