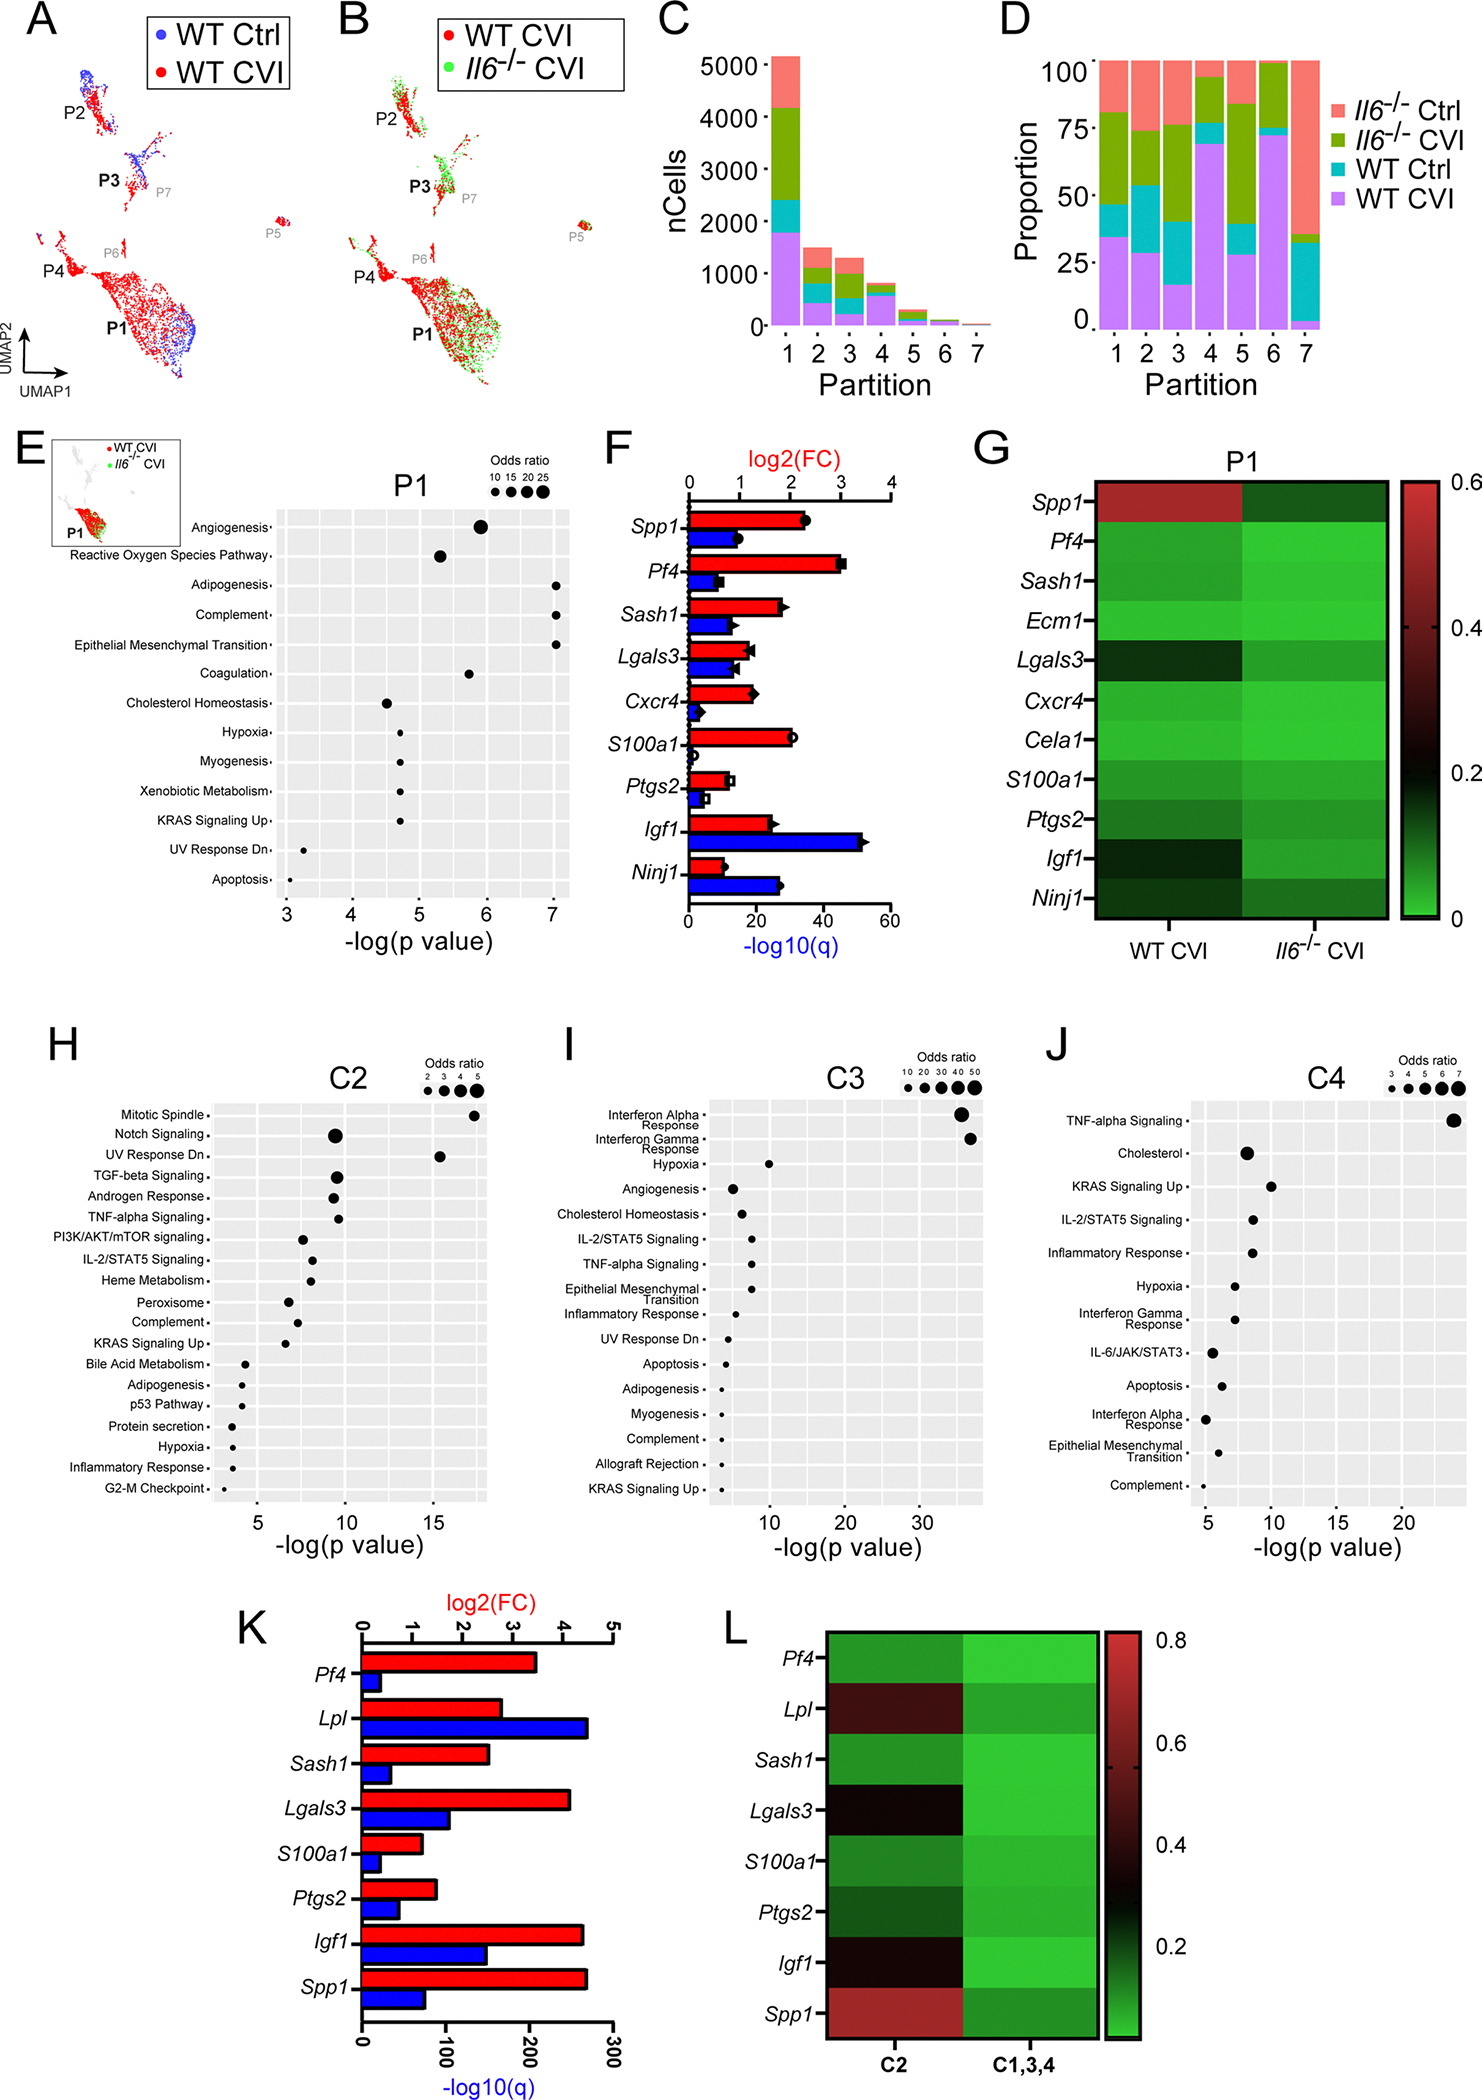
Extended Data Fig. 3 |. Single cell RNA-seq analysis of WT vs Il6−/− CVI mice.

a-b, UMAPs show overlays of all single cell partitions for uninjured Ctrl versus WT D6 CVI (a) and WT CVI versus Il6−/− CVI mice (b). c-d, Bar graphs depict the number (c) and percentage (d) of cells corresponding to each mouse group for the 7 different partitions. e, UMAP inset shows an overlay of WT CVI versus Il6−/− CVI mice for all partitions. Top pathways are also shown based on gene set enrichment analysis of DEGs (Q<0.05) between injured WT versus Il6−/− mice in P1. Only statistically significant pathway terms are plotted on the graph (P<0.05; Fisher exact test), and dot size represents the odds ratio. f, Bar graph shows statistical significance (−log q value; blue) and the expression level (log2 fold change; red) for genes involved in angiogenesis, the top-rated signaling pathway from gene set enrichment analysis in (e). g, Heatmap shows the mean expression of genes associated with angiogenesis for injured WT and Il6−/− mice. The color legend (right) depicts the gene expression level. h-j, Top pathways are shown based on gene set enrichment analysis of DEGs (Q<0.05) between uninjured and injured WT mice in P1 C2 (h), 3 (i), and 4 (j). Only statistically significant pathway terms are plotted on the graphs (P<0.05; Fisher exact test), and dot size represents the odds ratio. k, Bar graph shows statistical significance (−log q value; blue) and the expression level (log2 fold change; red) for genes involved in angiogenesis for C2 vs C1, 3, and 4 within P1. l, Heatmap shows the mean expression of genes associated with angiogenesis in panel k.
