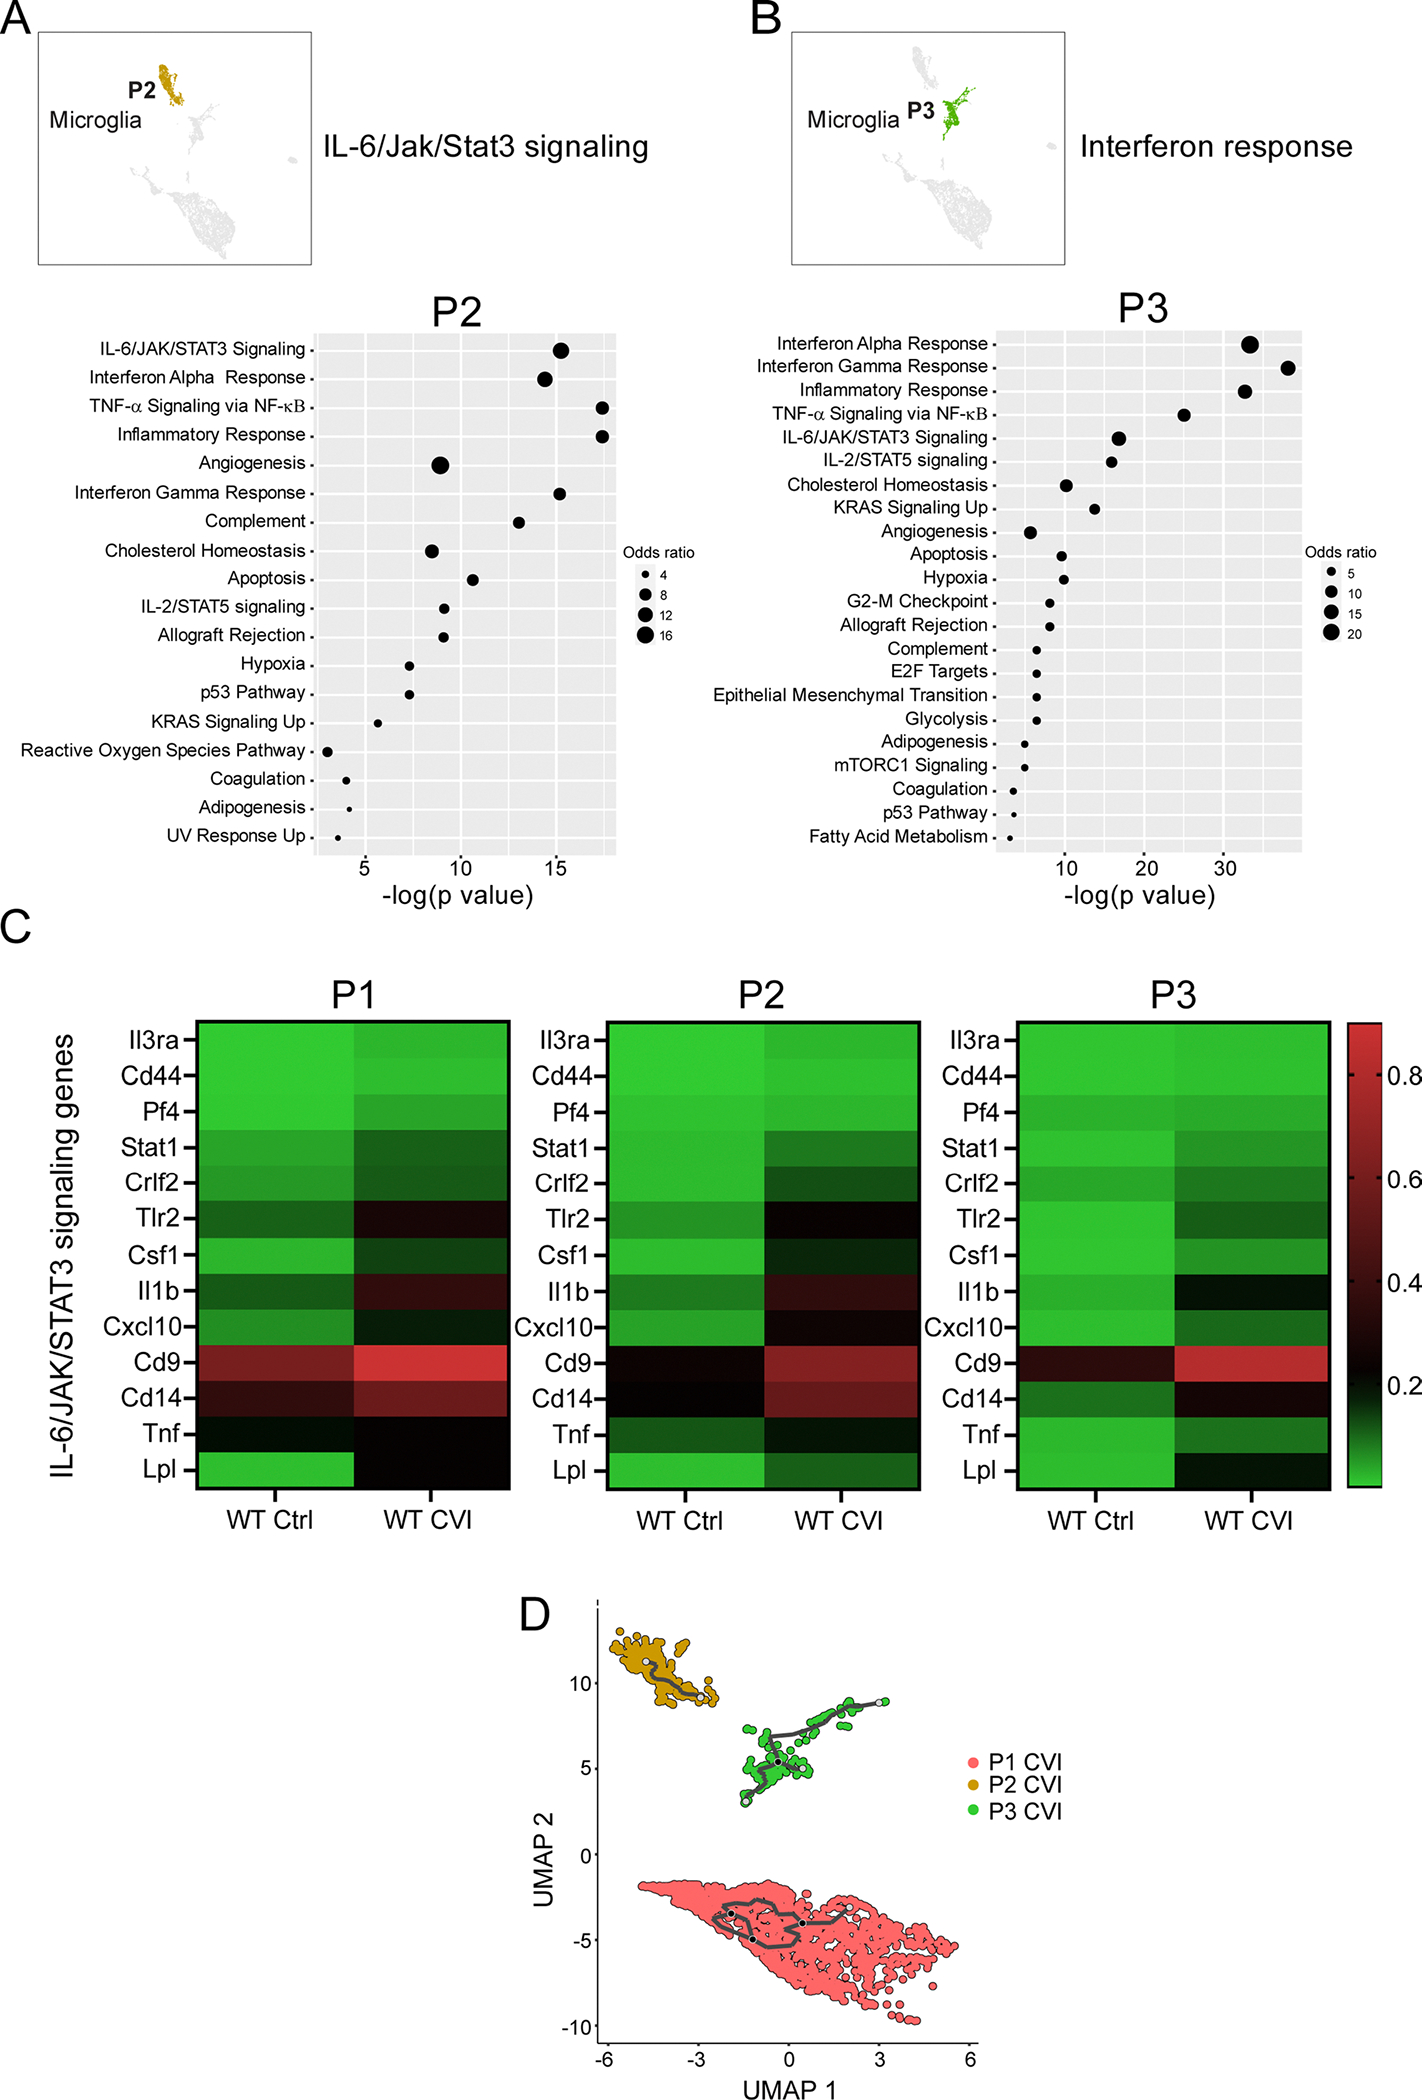
Extended Data Fig. 4 |. Analysis of signaling pathways in microglia partitions identified by scRNA-seq.

a-b, UMAP insets show all partitions and the location of P2 (a) and 3 (b). Dot plots depict the top pathways in the respective partitions based on gene set enrichment analysis of DEGs (Q<0.05) between WT Ctrl and CVI mice. Dot size corresponds to the odds ratio. Only statistically significant pathways (P<0.05) are shown on the graph. Pathways are ordered based on the negative log of the P value multiplied by the corresponding Z score. The top ranked pathways are listed next to the UMAP insets. c, Heatmaps show mean expression levels of genes associated with IL-6/JAK/Stat3 signaling between WT and Il6−/− CVI mice for P1, 2, and 3. The color legend (right) depicts the gene expression level. d, UMAP plot shows differentiation trajectories for P1, 2, and 3 microglia. Individual dots represent single cells and the distance between two cells infers transcriptional similarity. Black traces represent trajectory branches. Each light grey circle denotes a different outcome of the trajectory. Black circles indicate branch nodes, from which cells can move to one of the denoted outcomes.
