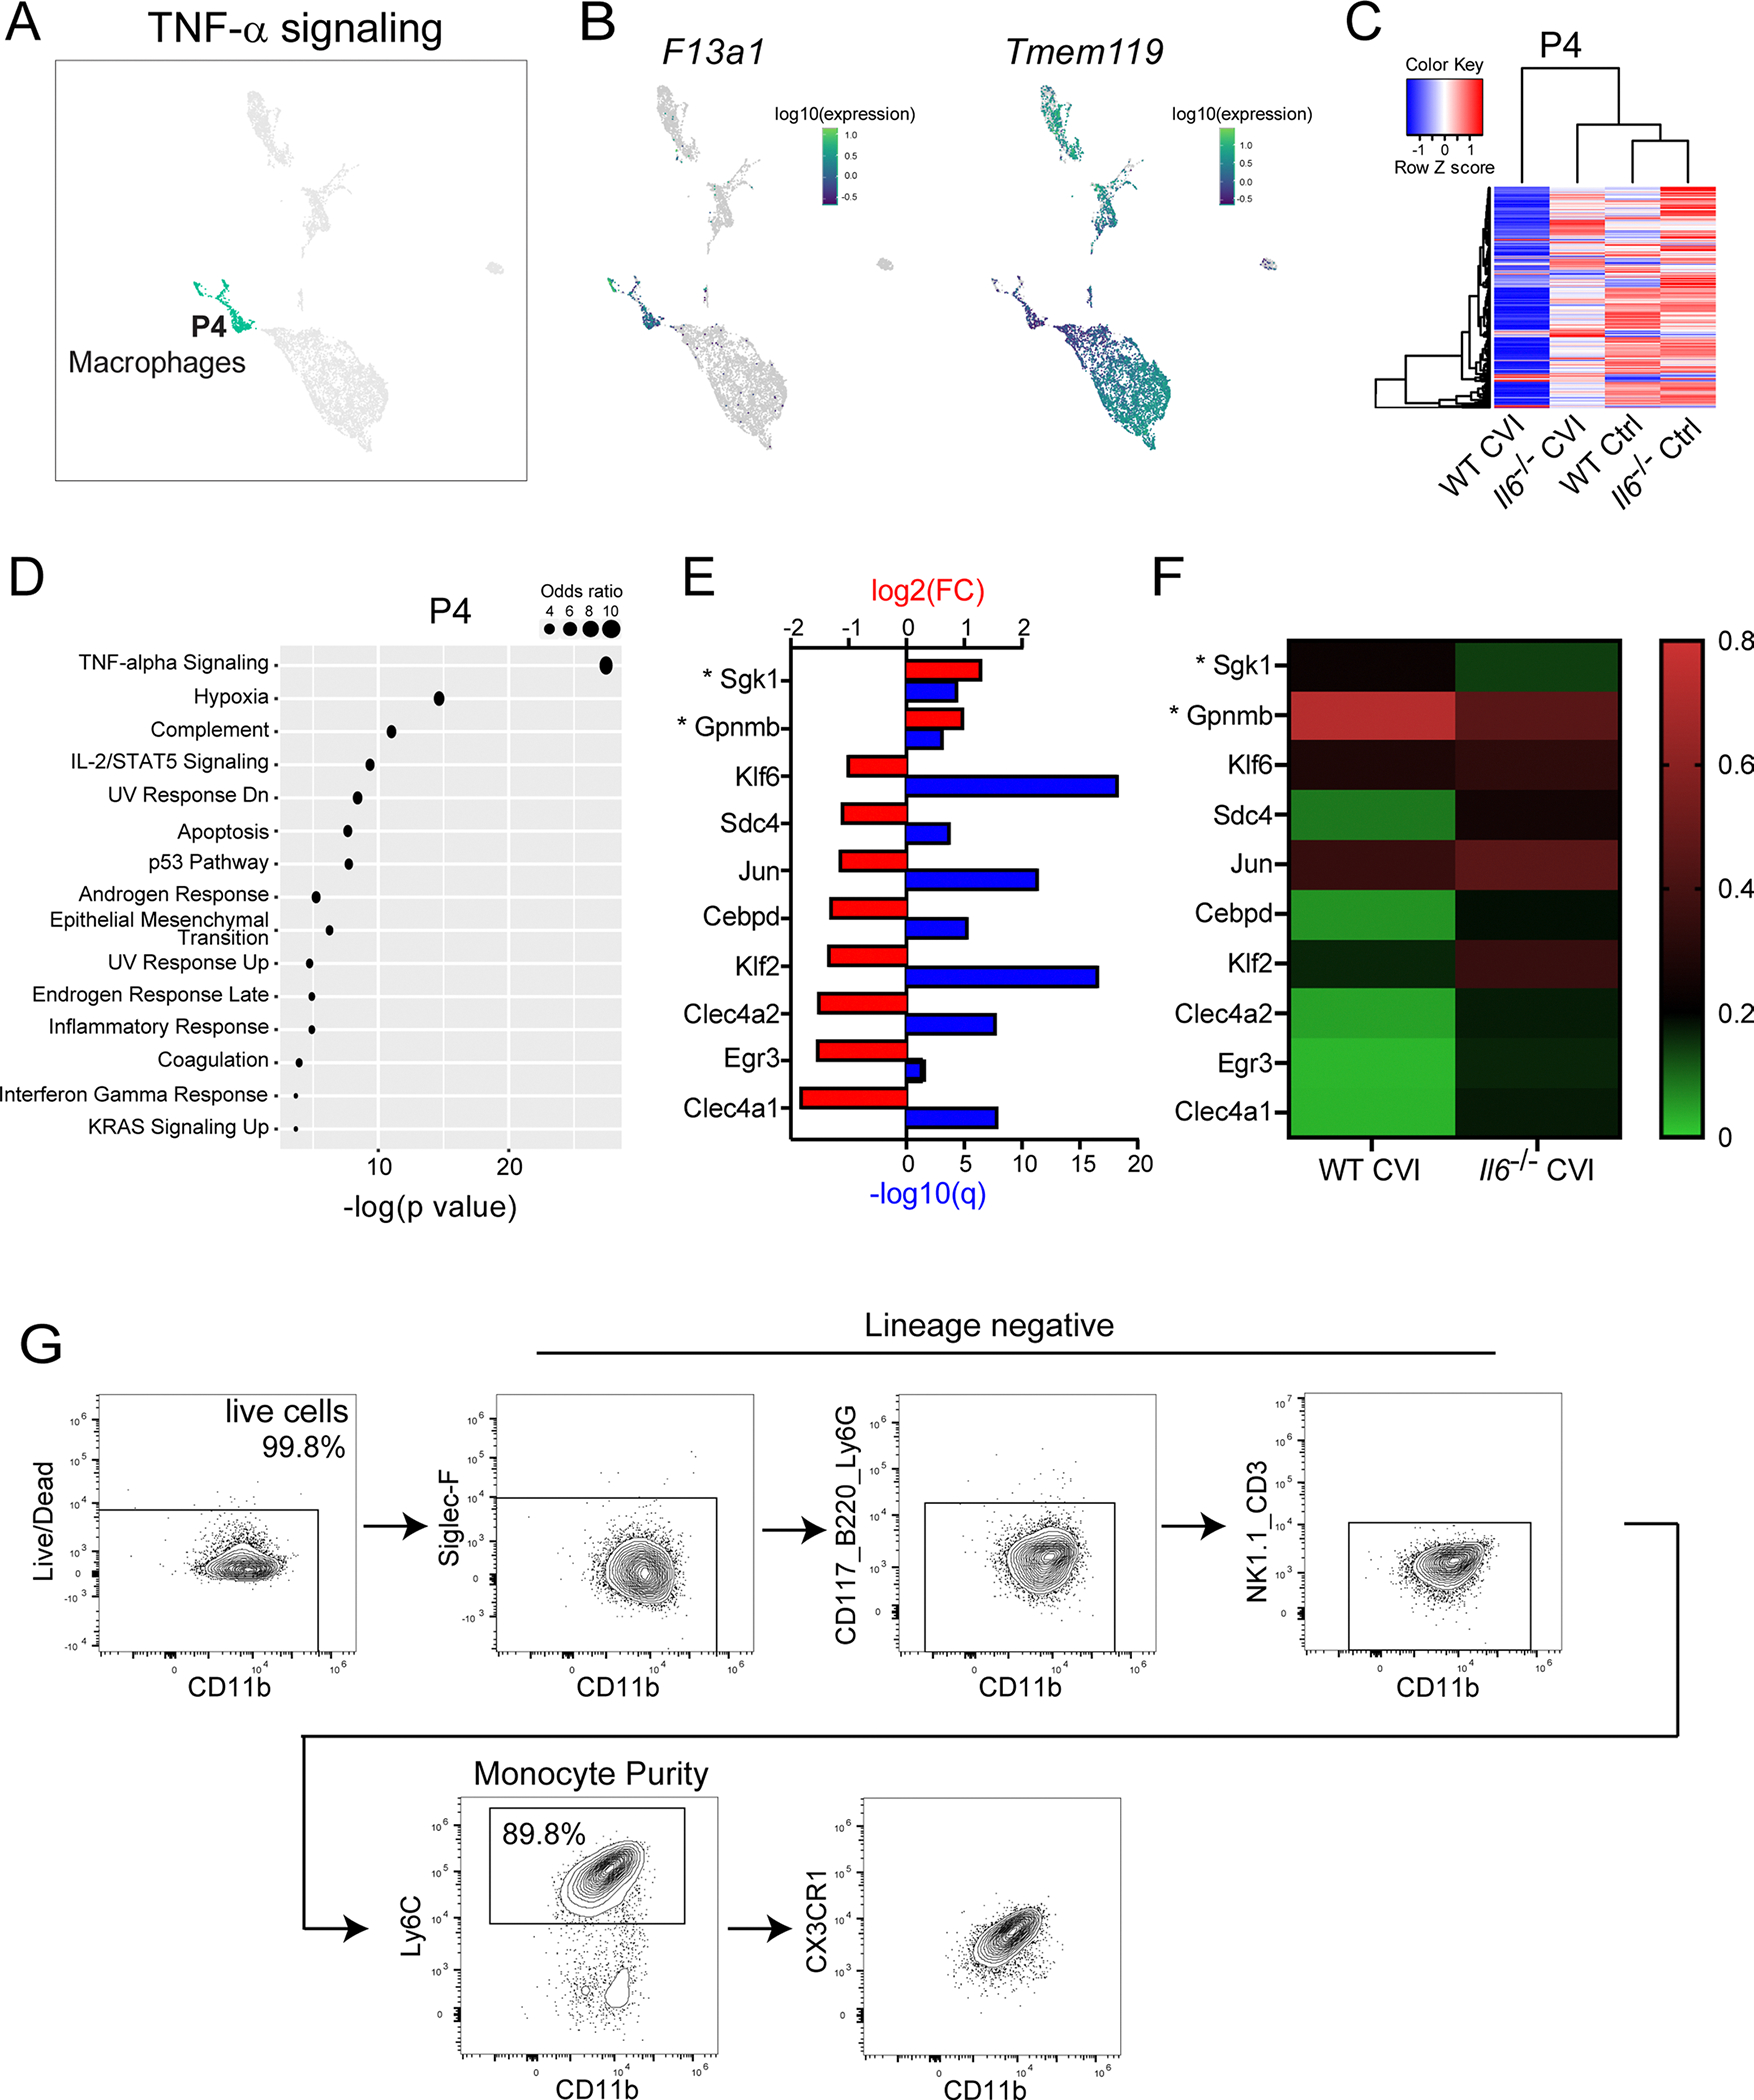
Extended Data Fig. 5 |. scRNA-seq analysis of macrophages and flow cytometric purity of sorted monocytes.

a, UMAP shows all partitions and the location of P4, which corresponds to macrophages. The top ranked pathway in P4 is noted above the UMAP. b, UMAPs depict expression of F13a1 and Tmem119 in all partitions. c, Pearson correlation-based clustered heatmap using DEGs (Q<0.05) between WT Ctrl and CVI mice in P4. The color legend reflects the Z score. d, Dot plot depicts the top pathways in P4 based on gene set enrichment analysis of DEGs (q<0.05) between WT and Il6−/− CVI mice. Dot size corresponds to the odds ratio. Only statistically significant pathways (P<0.05) are shown on the graph. Pathways are ordered based on the negative log of the P value multiplied by the corresponding Z score. e, Bar graph shows statistical significance (−log q value; blue) and the expression level (log2 fold change; red) for genes involved in TNFα signaling, the top-rated signaling pathway from gene set enrichment analysis in (d). Asterisks denote suppressor genes. f, Heatmap shows mean expression levels of genes in (e) for WT and Il6−/− CVI mice. The color legend (right) depicts the gene expression level. g, Gating strategy used for flow cytometric analysis of purified bone marrow-derived monocytes (CD11b+ Ly6C+ CX3CR1+ CD3− Siglec F− NK1.1− Ly6G− CD117− CD220−) from WT or Il6−/− mice that were adoptively transferred into Ccr2−/− recipients as described in Fig. 5d,e.
