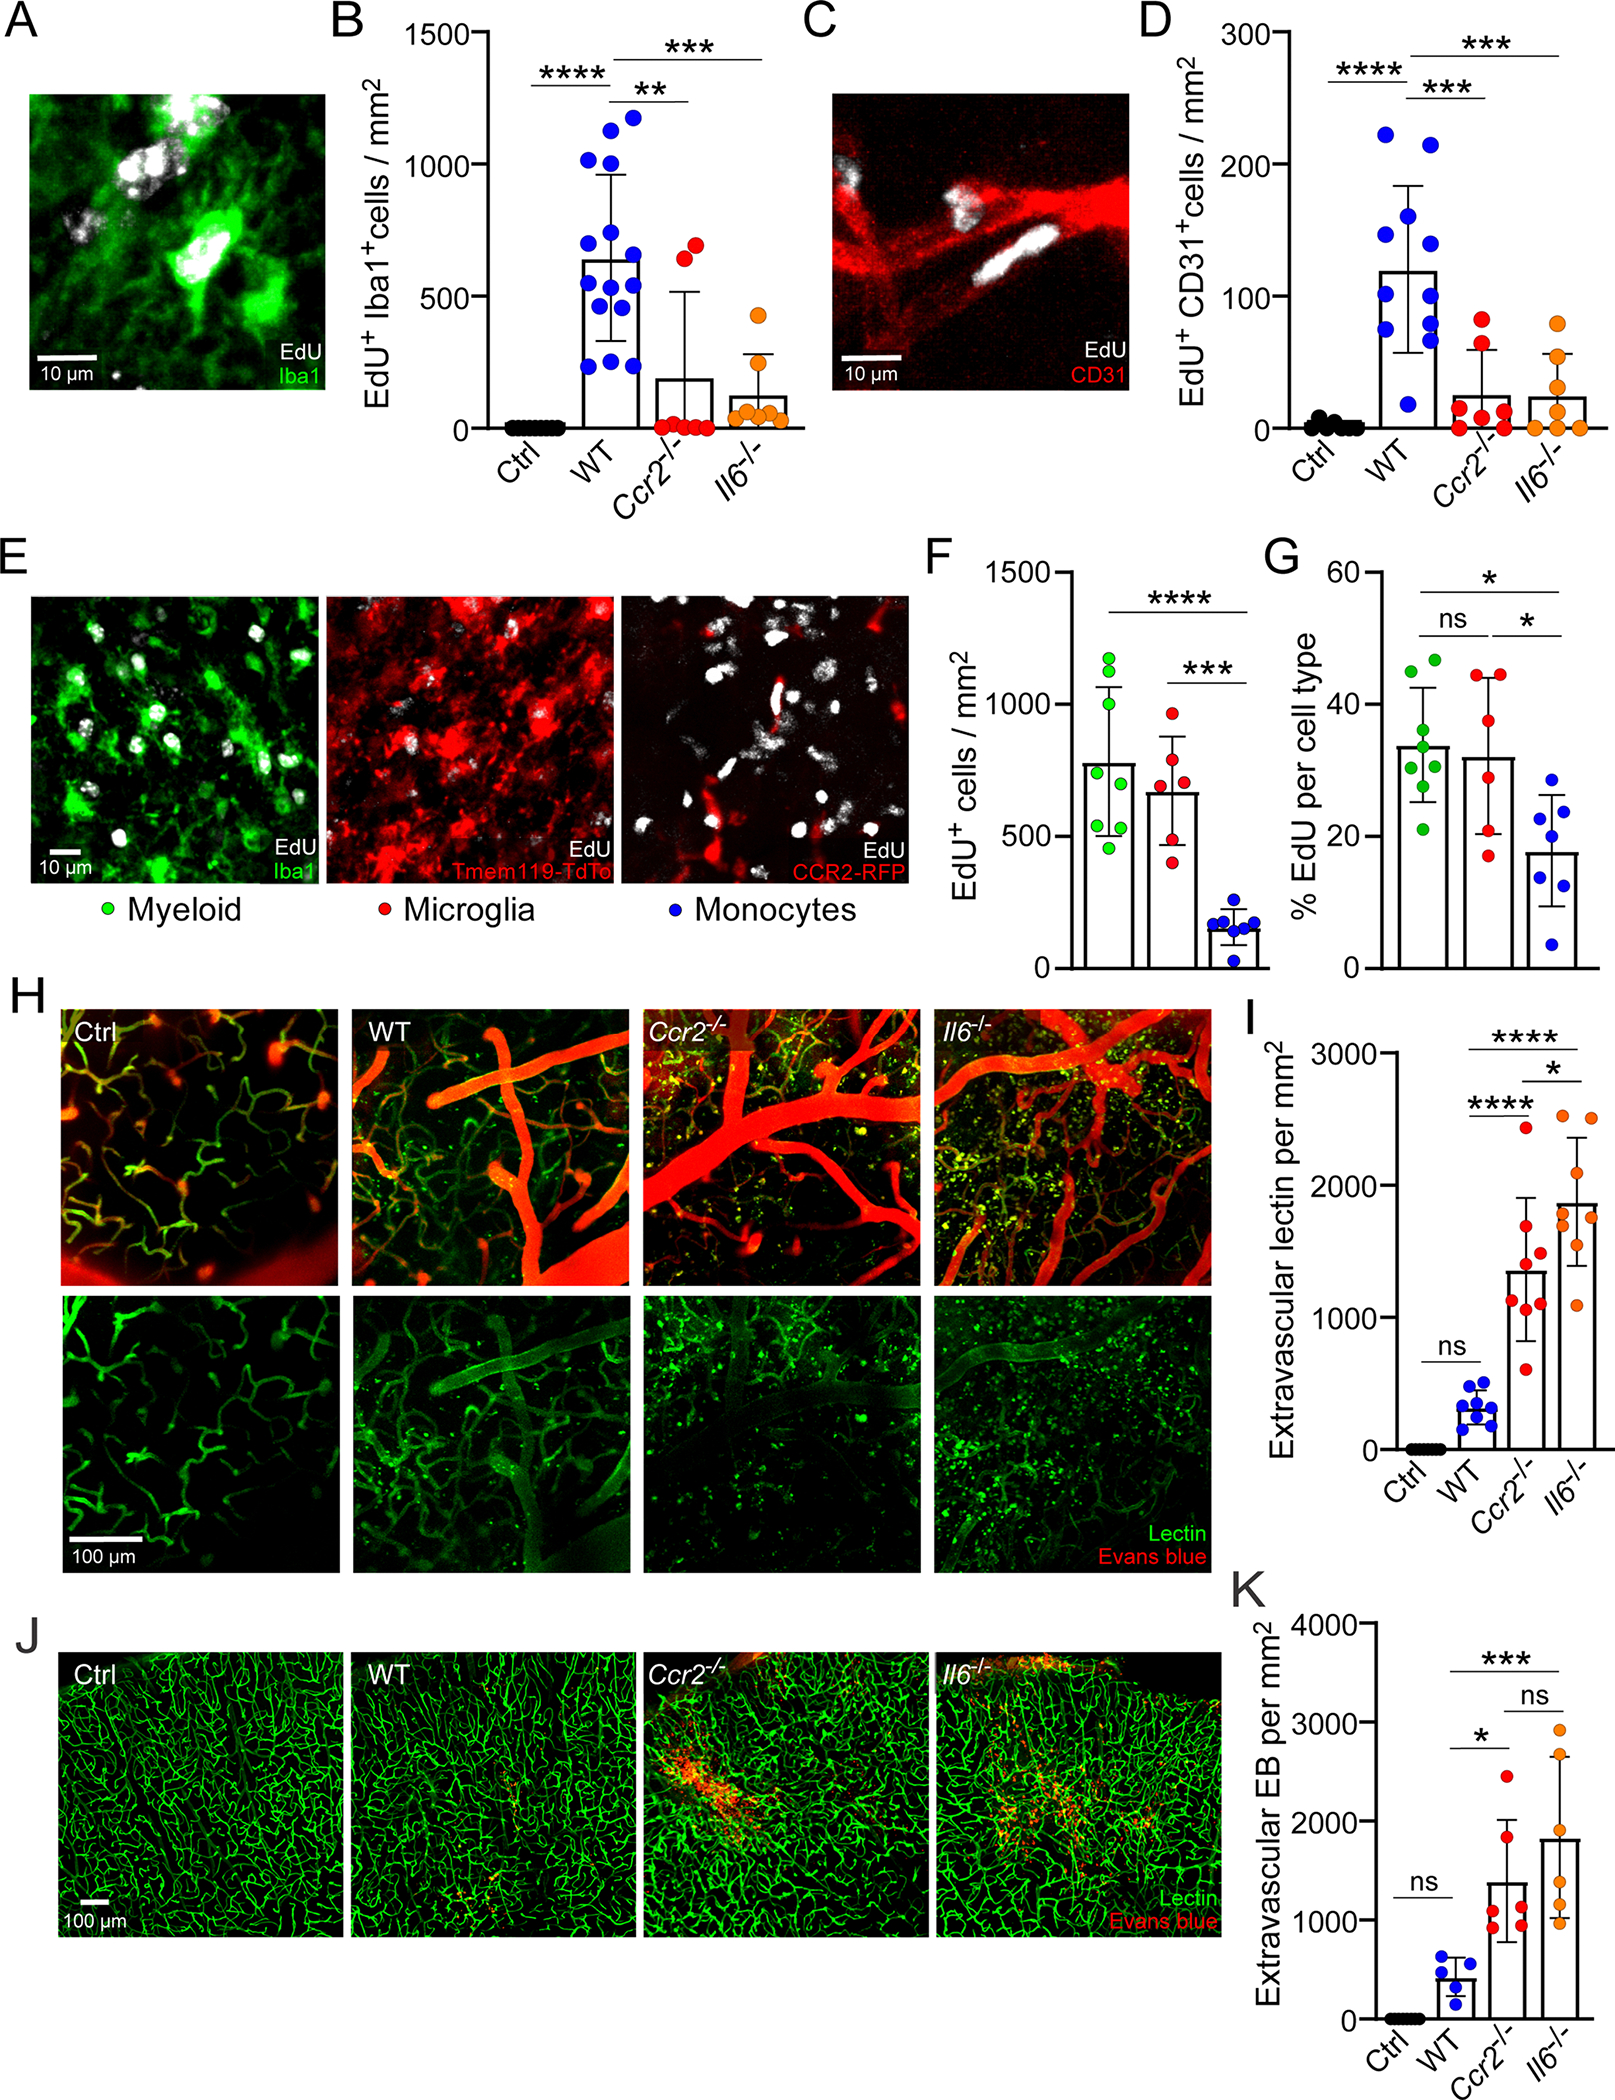
Extended Data Fig. 6 |. Quantification of cell proliferation and vascular leakage after CVI.

a-d, Representative confocal images from the neocortex stained for Iba1 (green) and EdU (white) (a) or CD31 (red) and EdU (white) (c). Bar graphs show the number of EdU+ Iba1+ cells (b) and EdU+ CD31+ cells (d) in uninjured WT Ctrl (n=9) versus D6 post-CVI WT (n=15), Ccr2−/− (n=7), and Il6−/− (n=7) mice at D6 post-CVI. Data are combined from two independent experiments. (**P<0.01, ***P<0.001, ****P<0.0001; one-way ANOVA with Tukey’s test). e-g, Representative confocal images from the neocortex stained for Iba1 (green), Tmem119-TdTo (red), CCR2-RFP (red), and EdU (white). Bar graphs show the number (f) and percentage (g) of EdU+ cells that are myeloid (green), microglia (red), and monocytes (blue) based on analysis of WT (n=8), Tmem119-TdTo (n=6), and CX3CR1gfp/+ CCR2rfp/+ (n=7) mice at D6 post-CVI. Data are combined from two independent experiments. (*P<0.05, ***P<0.001, ****P<0.0001; one-way ANOVA with Tukey’s test). h, Representative intravital TPM images captured through the thinned skull of uninjured WT Ctrl (n=8) versus CVI WT (n=8), Ccr2−/− (n=8), and Il6−/− (n=8) mice at D10 post-mild CVI. Tomato lectin (green) and Evans blue (red) were injected i.v. to visualize vasculature and dye extravasation. i, Bar graph depicts quantification of extravasated tomato lectin based on the dataset in (h). Data are combined from two independent experiments. (*P<0.05, ****P<0.0001; one-way ANOVA with Tukey’s test). j, Representative confocal images from the neocortex of uninjured WT Ctrl (n=7) versus D6 post-CVI WT (n=5), Ccr2−/− (n=6), and Il6−/− (n=6) mice at D10 post-CVI show i.v. injected tomato lectin (green) and Evans blue (red). k, Bar graph shows quantification of extravasated Evans blue (EB) based on the dataset shown in (j). Data are combined from two independent experiments. (*P<0.05, ***P<0.001; one-way ANOVA with Tukey’s test). All graphs show mean ± SEM. Dots represent individual mice.
