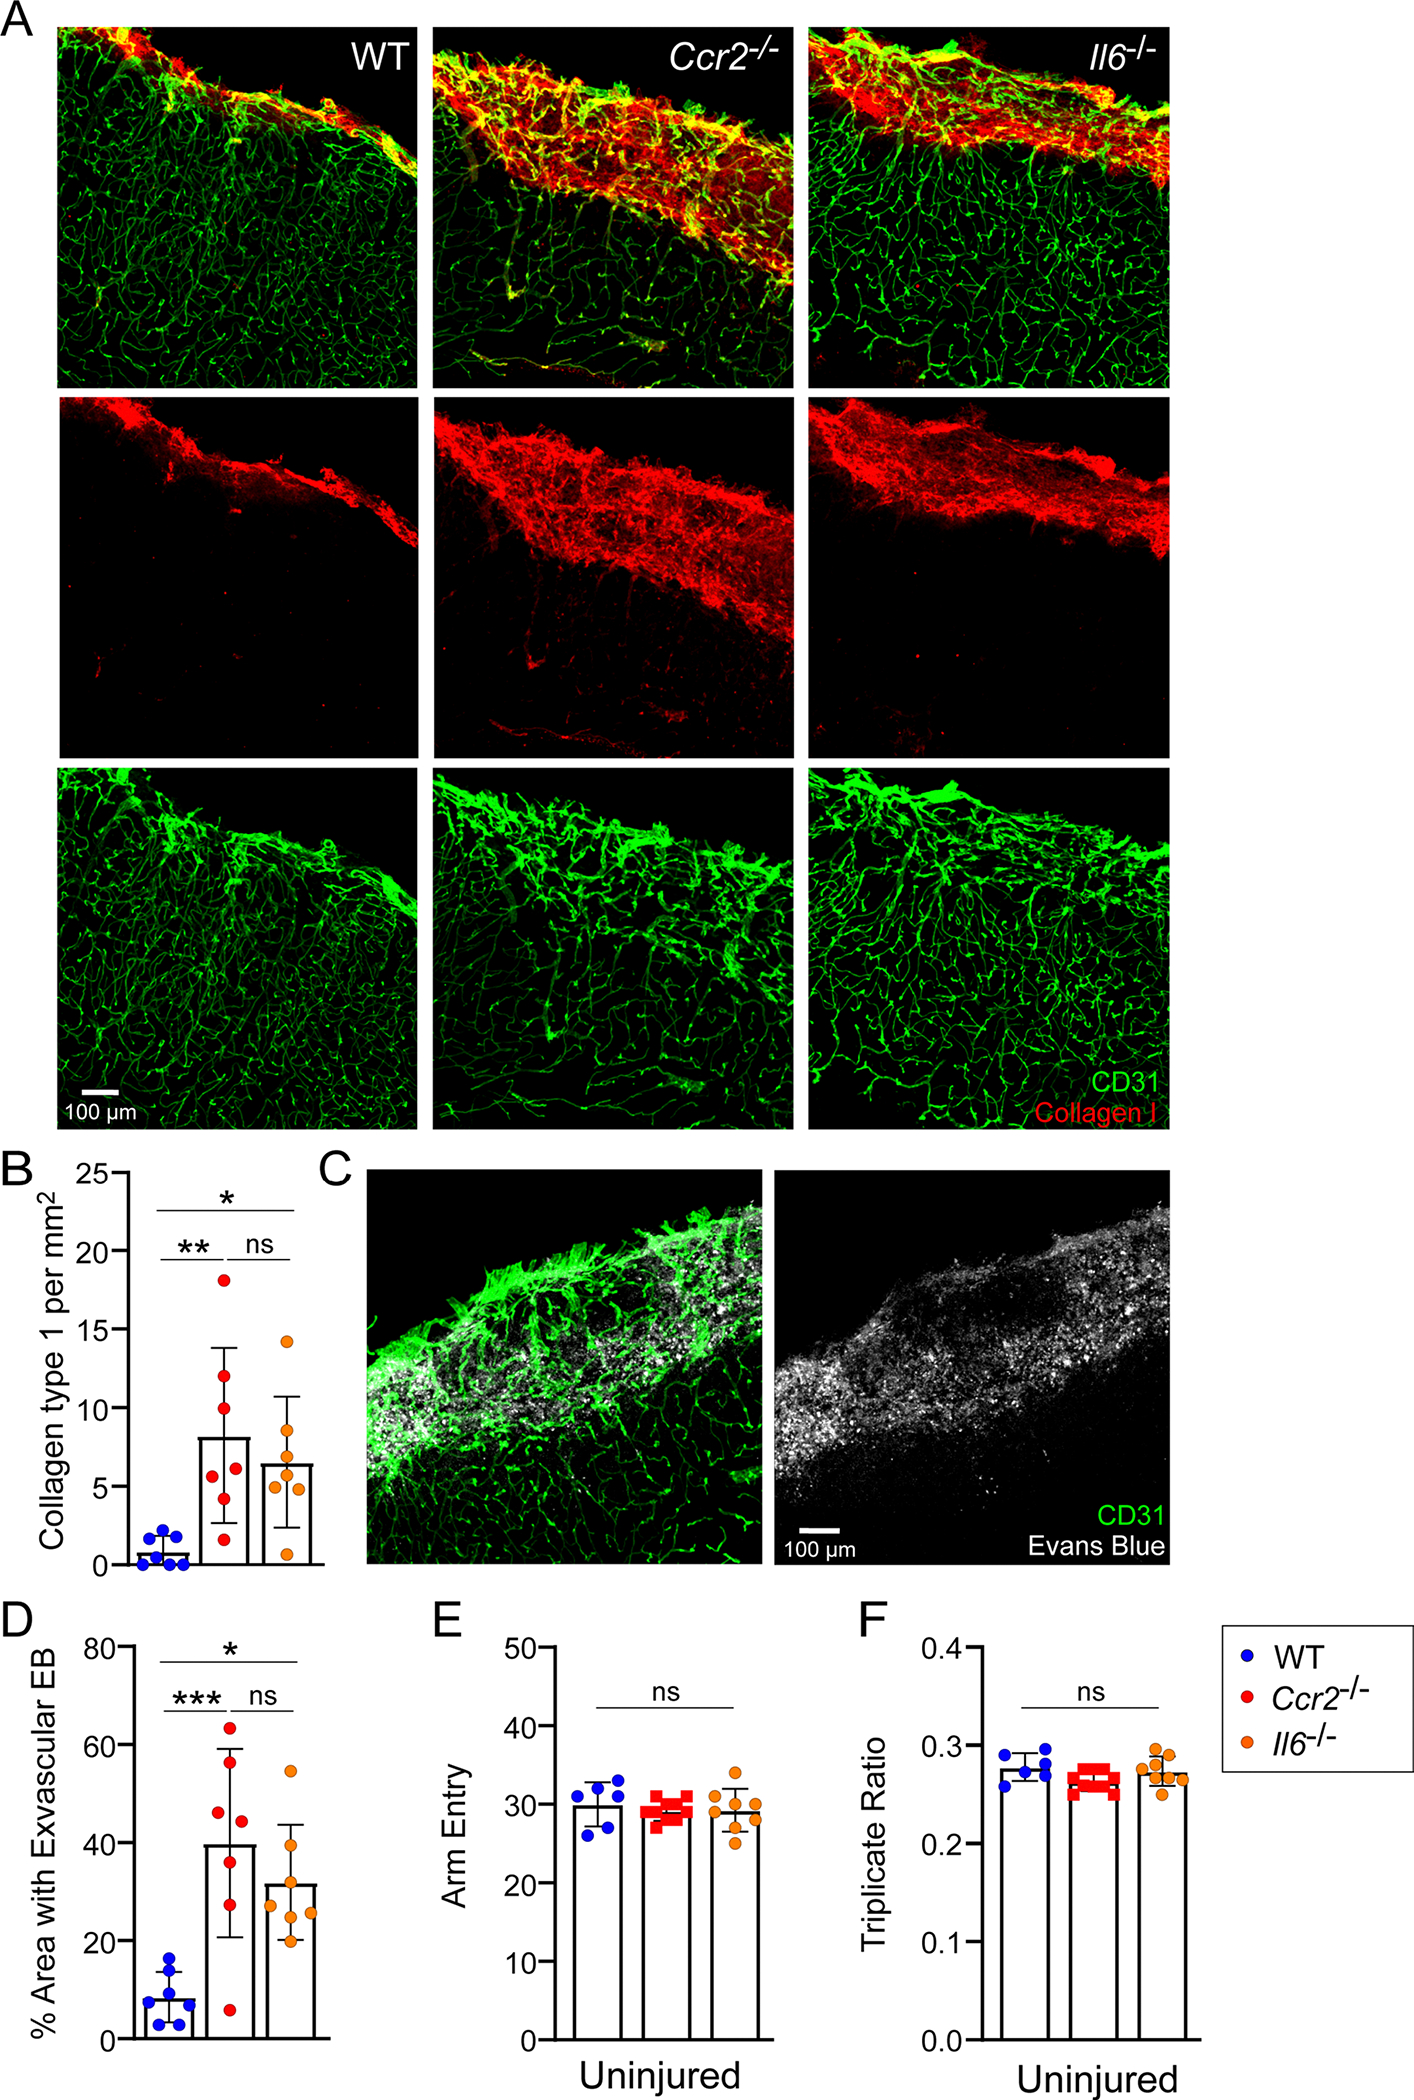
Extended Data Fig. 7 |. Evaluation of Y-maze performance in uninjured mice and quantification of type 1 collagen deposition and Evans blue leakage after CVI.

a, Representative confocal images from the neocortex of WT (n=7), Ccr2−/− (n=7), and Il6−/− (n=7) mice at D10 post-CVI show staining for CD31 (green) and collagen type 1 (red). b, Bar graph shows quantification of collagen type 1 based on the dataset shown in (a). Data are combined from two independent experiments. (*P<0.05, **P<0.01; one-way ANOVA with Tukey’s test). c, Representative confocal images from the neocortex of WT (n=7), Ccr2−/− (n=7), and Il6−/− (n=7) mice at D10 post-CVI show staining for CD31 (green) and i.v. injected Evans blue (white). d, Bar graph shows quantification of extravasated Evans blue (EB) based on the dataset shown in (c). Data are combined from two independent experiments. (*P<0.05, ***P<0.001; one-way ANOVA with Tukey’s test). All graphs show mean ± SEM. Dots represent individual mice. e-f, Bar graphs demonstrate the total number of Y maze arm entries (e) and the triplicate ratio (f) for uninjured WT (n=6), Ccr2−/− (n=10), and Il6−/− (n=8) mice. Data are from a single experiment. All graphs show mean ± SEM (one-way ANOVA with Tukey’s test). Dots represent individual mice.
