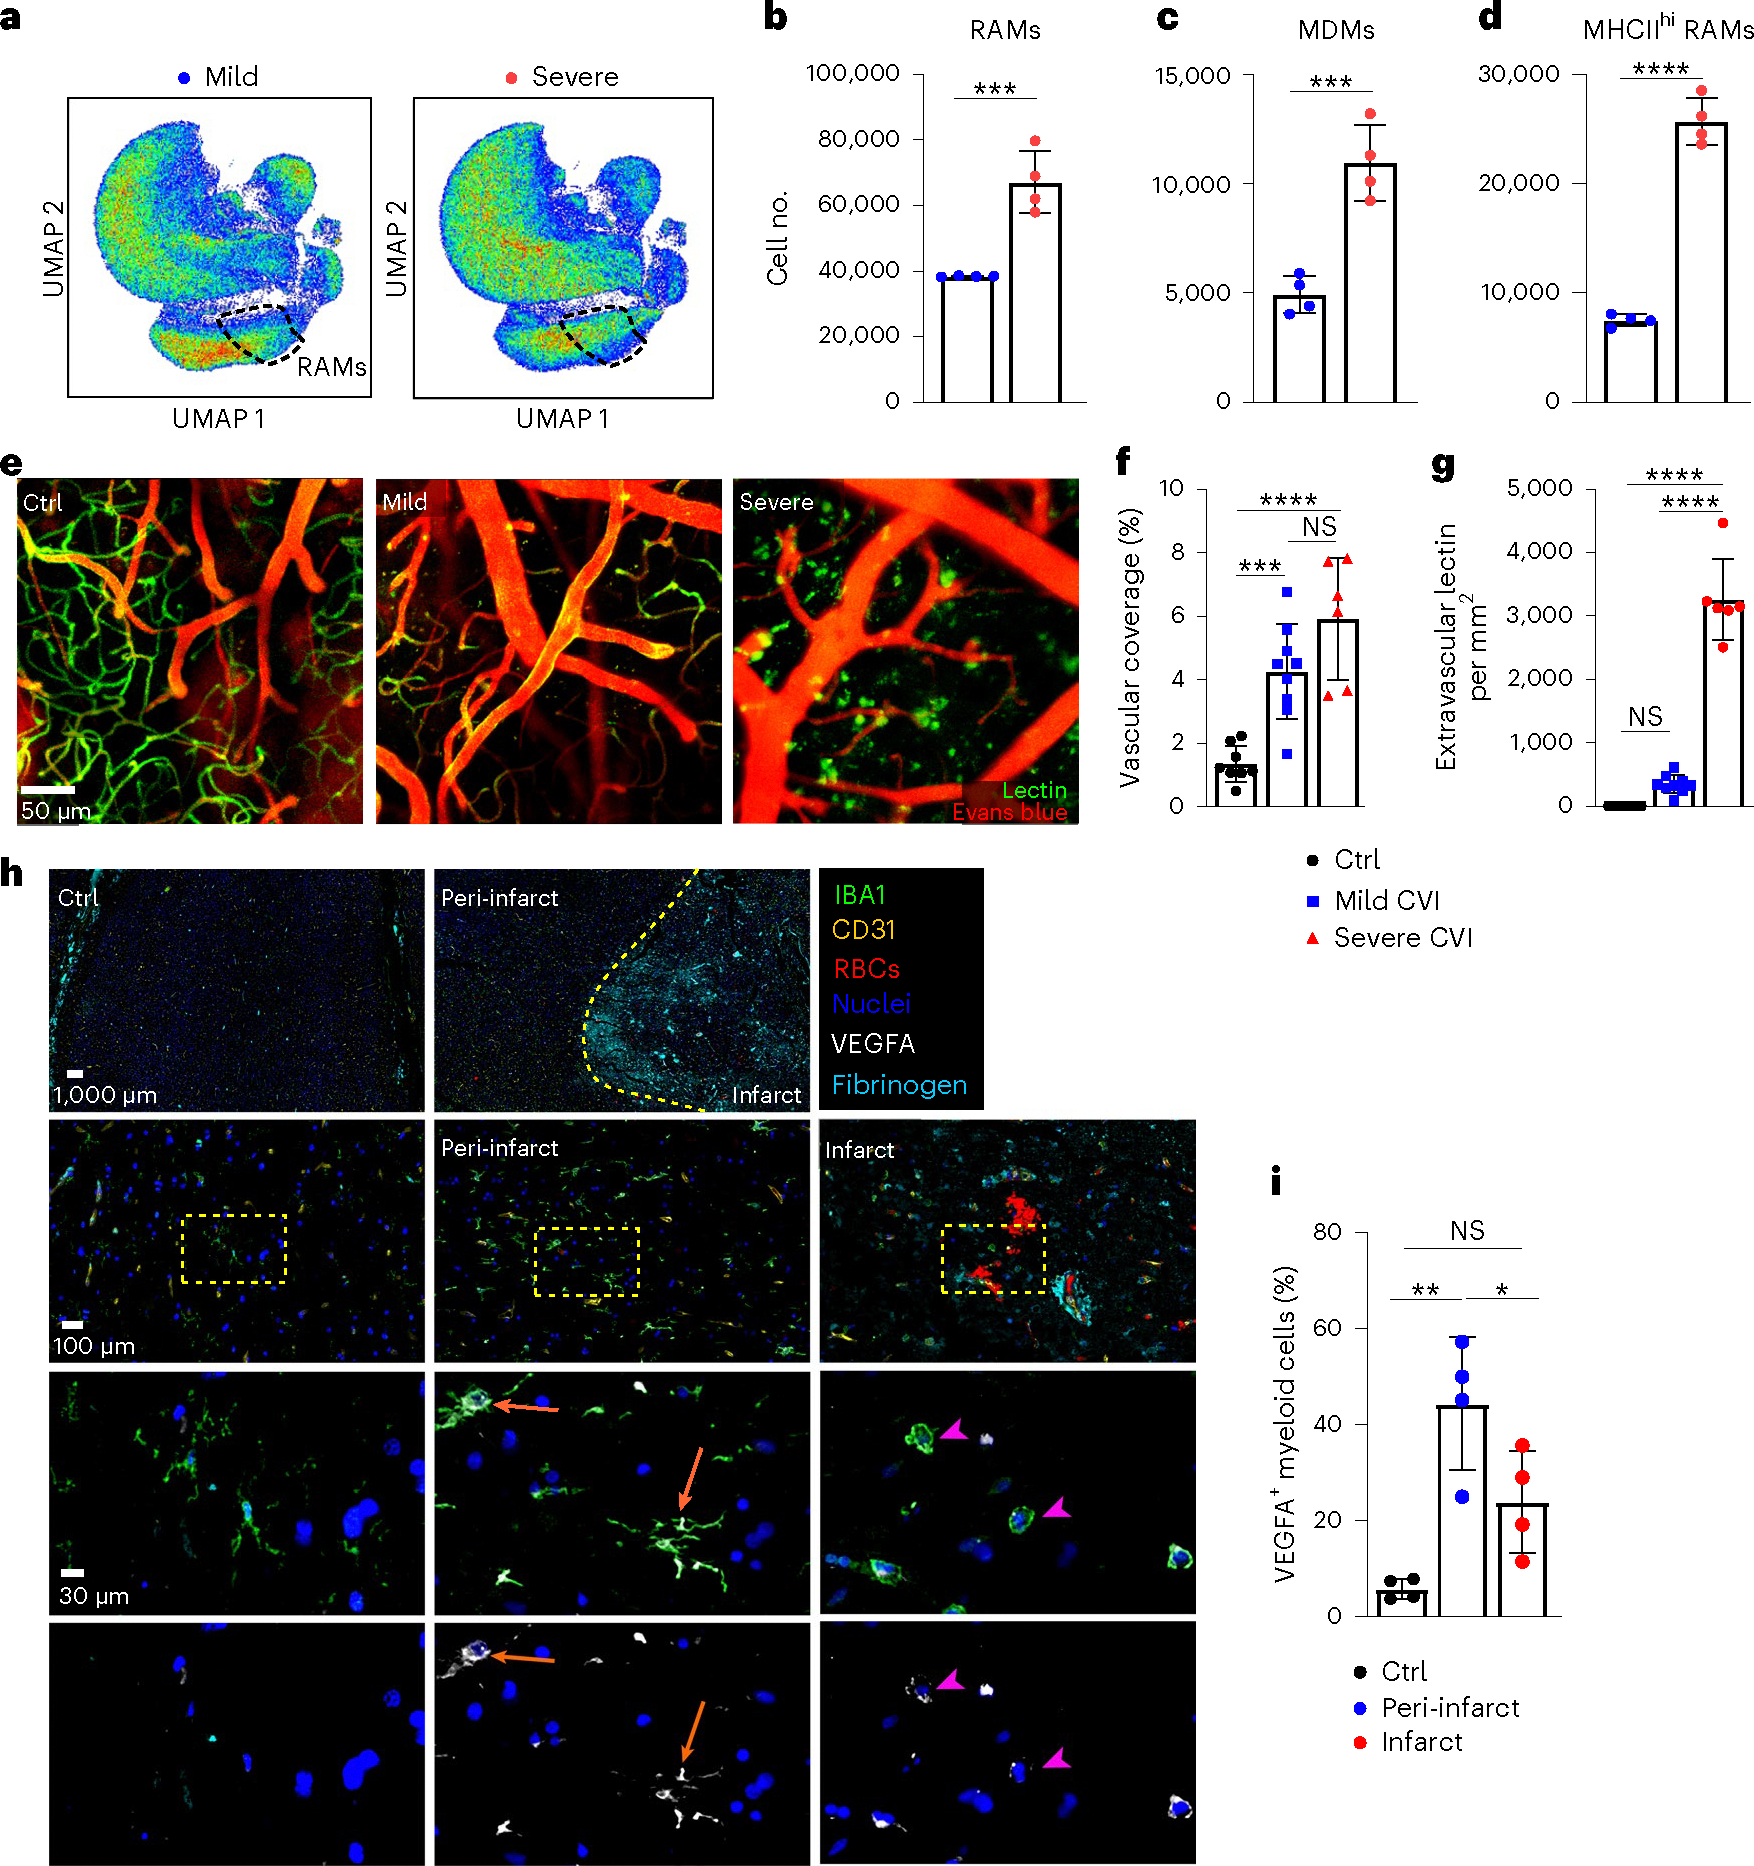
Fig. 2 |. RAMs increase with lesion severity and are observed in human stroke brains.

a, Representative UMAPs depicting high-parameter flow cytometry data of leukocytes isolated from the brains of day 6 mild (n = 4) versus severe (n = 4) CVI Tmem119-TdTo mice by punch biopsy. The dashed lines denote RAMs. b–d, Bar graphs show the absolute number of RAMs (TdTo+VEGFA+IL-6Ra+CD24+CD44+CD206+CD11c+Ly6clo/intMHCIIloCX3CR1+CD11b+CD45lo/int) (b), MHCIIhi RAMs (TdTo+VEGFA+IL-6Ra+CD24+CD44+CD206+CD11c+Ly6c+MHCIIhiCX3 CR1+CD11b+CD45+) (c) and MDMs (TdTo−CD24+CD44+CD206+CD11c+Ly6c+CX3CR 1+CD11b+CD45+) (d) for the groups indicated in a. Data represent two independent experiments. ***P < 0.0005, ****P < 0.0001; two-tailed, unpaired Student’s t-test. e, Representative maximal projection images captured by intravital TPM showing vasculature in the superficial neocortex of uninjured Ctrl (n = 8) versus day 10 mild (n = 9) and severe (n = 6) CVI mice. Tomato lectin (green) and EB (red) were injected i.v. before imaging. f,g, Bar graphs showing quantification of percentage vascular coverage (f) and the amount of extravasated tomato lectin (g) in the mice from e. Data are combined from two independent experiments. ***P < 0.0005, ****P < 0.0001; one-way ANOVA with Tukey’s test. In b–g, the dots represent individual animals. h, Representative multiplex immunostaining of human stroke (n = 4) brain tissue (patient ID AN-060–37) versus Ctrl (n = 4) brain tissue (patient ID 85747) without neurological disease (Supplementary Table 1). Tissue was stained with antibodies directed against VEGFA (white), IBA1 (green), RBCs, CD31 (yellow) and fibrinogen (cyan). Cell nuclei are blue. The dashed yellow line denotes a border between infarct core and peri-infarct penumbrae. The dotted yellow boxes denote the location of enlarged images below. The orange arrows point to IBA1+ cells with a ramified microglial morphology that express VEGFA in peri-infarct stroke tissue. The pink arrowheads denote spherical IBA1+ cells expressing low amounts of VEGFA in the stroke lesion core. i, Bar graph showing quantification of the percentage VEGFA+IBA1+ myeloid cells in Ctrl, peri-infarct and infarct ROIs from Ctrl (n = 4) and stroke (n = 4) brain tissues. Individual dots denote the average of percentage VEGFA+IBA1+ myeloid cells from one to three ROIs per specimen analyzed (see Extended Data Fig. 2f). *P < 0.05, **P < 0.005; one-way ANOVA with Tukey’s test. All graphs show mean ± s.e.m.
