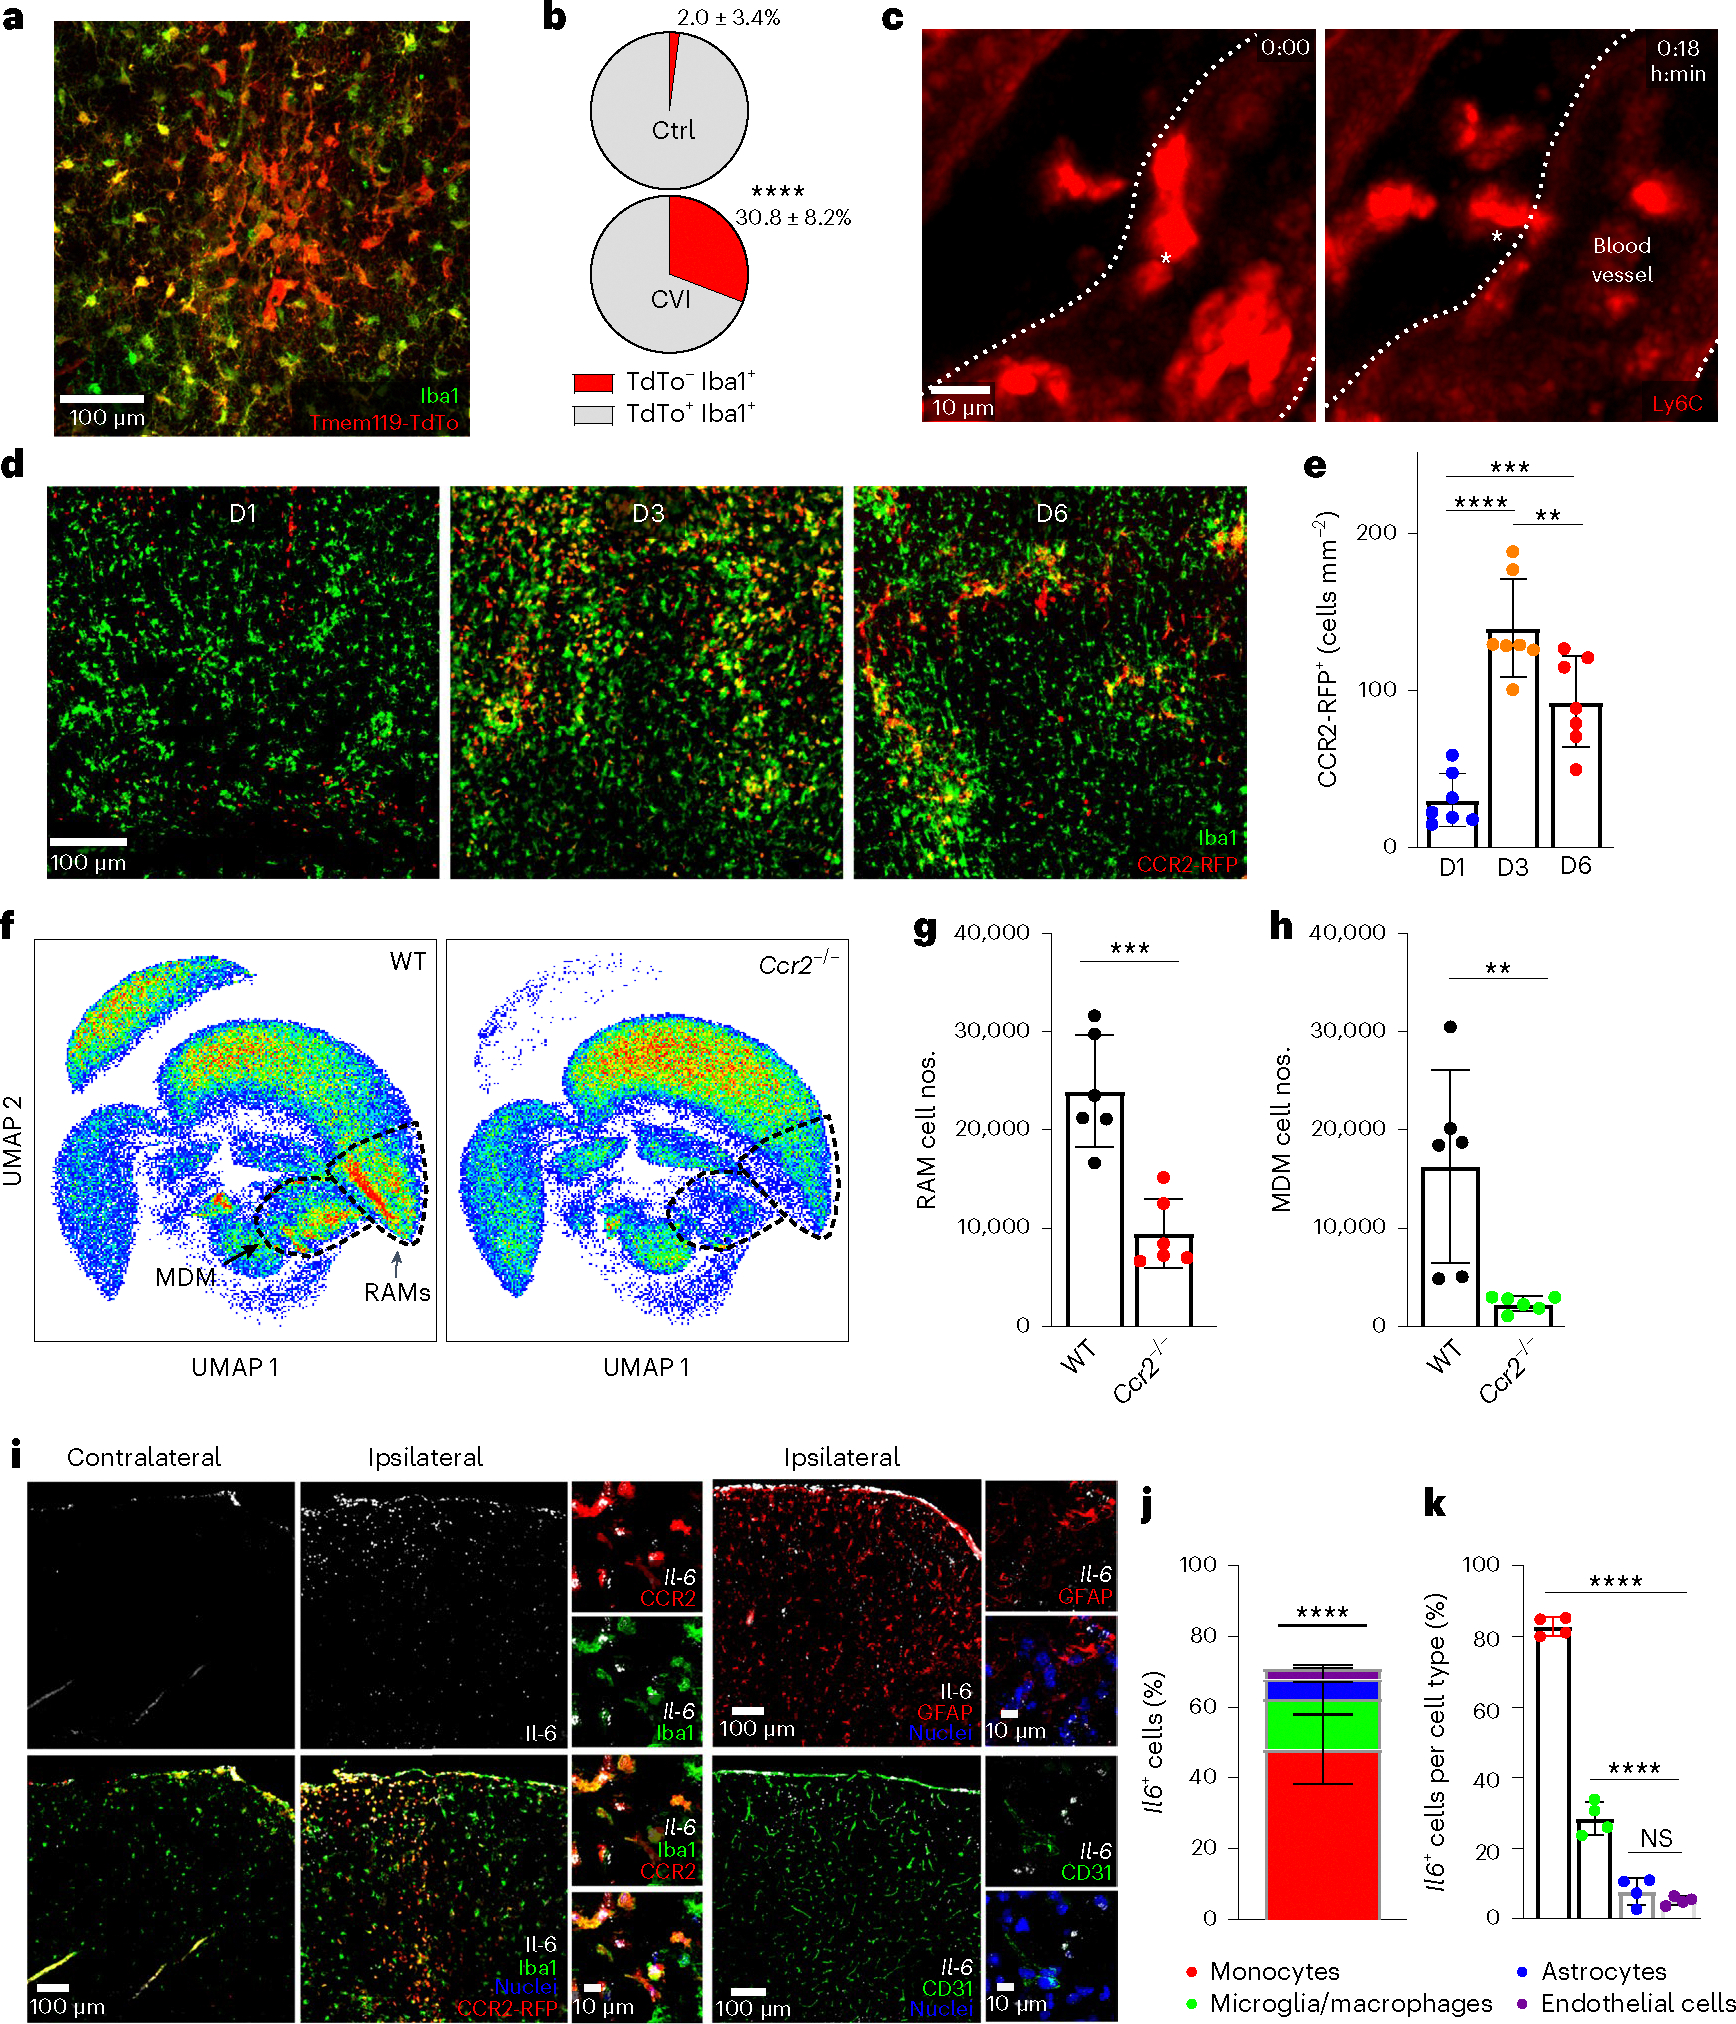
Fig. 3 |. Infiltrating monocytes produce IL-6 and are critical for RAM generation.

a, Immunofluorescent staining for Iba1 (green) and TdTo (red) in the neocortex of a Tmem119-TdTo mouse on day 6 post-CVI. Data represent two independent experiments. b, Pie charts depicting the proportion of TdTo−Iba1+ (monocytes/macrophages, red) and TdTo+ Iba1+ (microglia, gray) in the brains of uninjured Ctrl (n = 8) versus injured (n = 7) mice. Data represent two independent experiments. ****P < 0.0001; two-tailed, unpaired Student’s t-test. c, Time-lapse intravital TPM images showing monocyte extravasation into the parenchyma at day 2 post-CVI (n = 3 mice). The white asterisk denotes a Ly6c+ monocyte (red) extravasating from a blood vessel (demarcated by white dotted lines) into the parenchyma (Supplementary Video 2). d, Immunofluorescent staining for Iba1 (green) and RFP (red) in brains of CX3CR1gfp/+CCR2rfp/+ (n = 7 mice per group) at days 1, 3 and 6 (D1, D3, D6) post-CVI. Green fluorescent protein (GFP) and RFP were photobleached before anti-Iba1 and RFP staining. e, Bar graph depicting the absolute number of CCR2-RFP+ monocytes per mm2 of brain tissue at the denoted time points after a CVI. Combined data from two independent experiments are shown in d and e. **P < 0.005, ***P < 0.0005, ****P < 0.0001; one-way ANOVA with Tukey’s test. f, UMAPs showing high-parameter flow cytometric data of leukocytes isolated via punch biopsy from WT (n = 6) and Ccr2−/− (n = 6) mice on day 6 post-CVI. The dashed lines delineate RAMs and MDMs. g,h, Bar graphs showing the absolute number of RAMs (g) and MDMs (h) in WT versus Ccr2−/− mice derived from f. The cell cluster in the top left of the UMAPs corresponds to CD45− nonimmune cells. Data represent two independent experiments. **P < 0.005, ***P < 0.0005; two-tailed, unpaired Student’s t-test. i, Representative images of RNAscope in situ hybridization for Il-6 transcripts (white) combined with immunofluorescent staining for Iba1, RFP, GFAP and CD31 in ipsilateral (injured) versus contralateral (uninjured) neocortex of CX3CR1gfp/+CCR2rfp/+ mice (n = 4) at day 3 post-CVI. GFP and RFP were photobleached before anti-Iba1 and RFP staining. The following cell populations were identified: microglia/macrophages (Iba1+CCR2-RFP−), monocytes (CCR2-RFP+), astrocytes (GFAP+) and endothelial cells (CD31+). Cell nuclei are shown in blue. j,k, Bar graphs showing the percentage of each cell type expressing Il-6 (j) and the percentage of Il-6-expressing cells within each cell type (k) from the mice described in i. Combined data from two independent experiments are shown in i–k. The asterisks in j denote a statistically significant difference between monocytes and all other IL-6-expressing cells: ****P < 0.0001; one-way ANOVA with Tukey’s test. All graphs in this figure show mean ± s.e.m. The dots represent individual animals.
