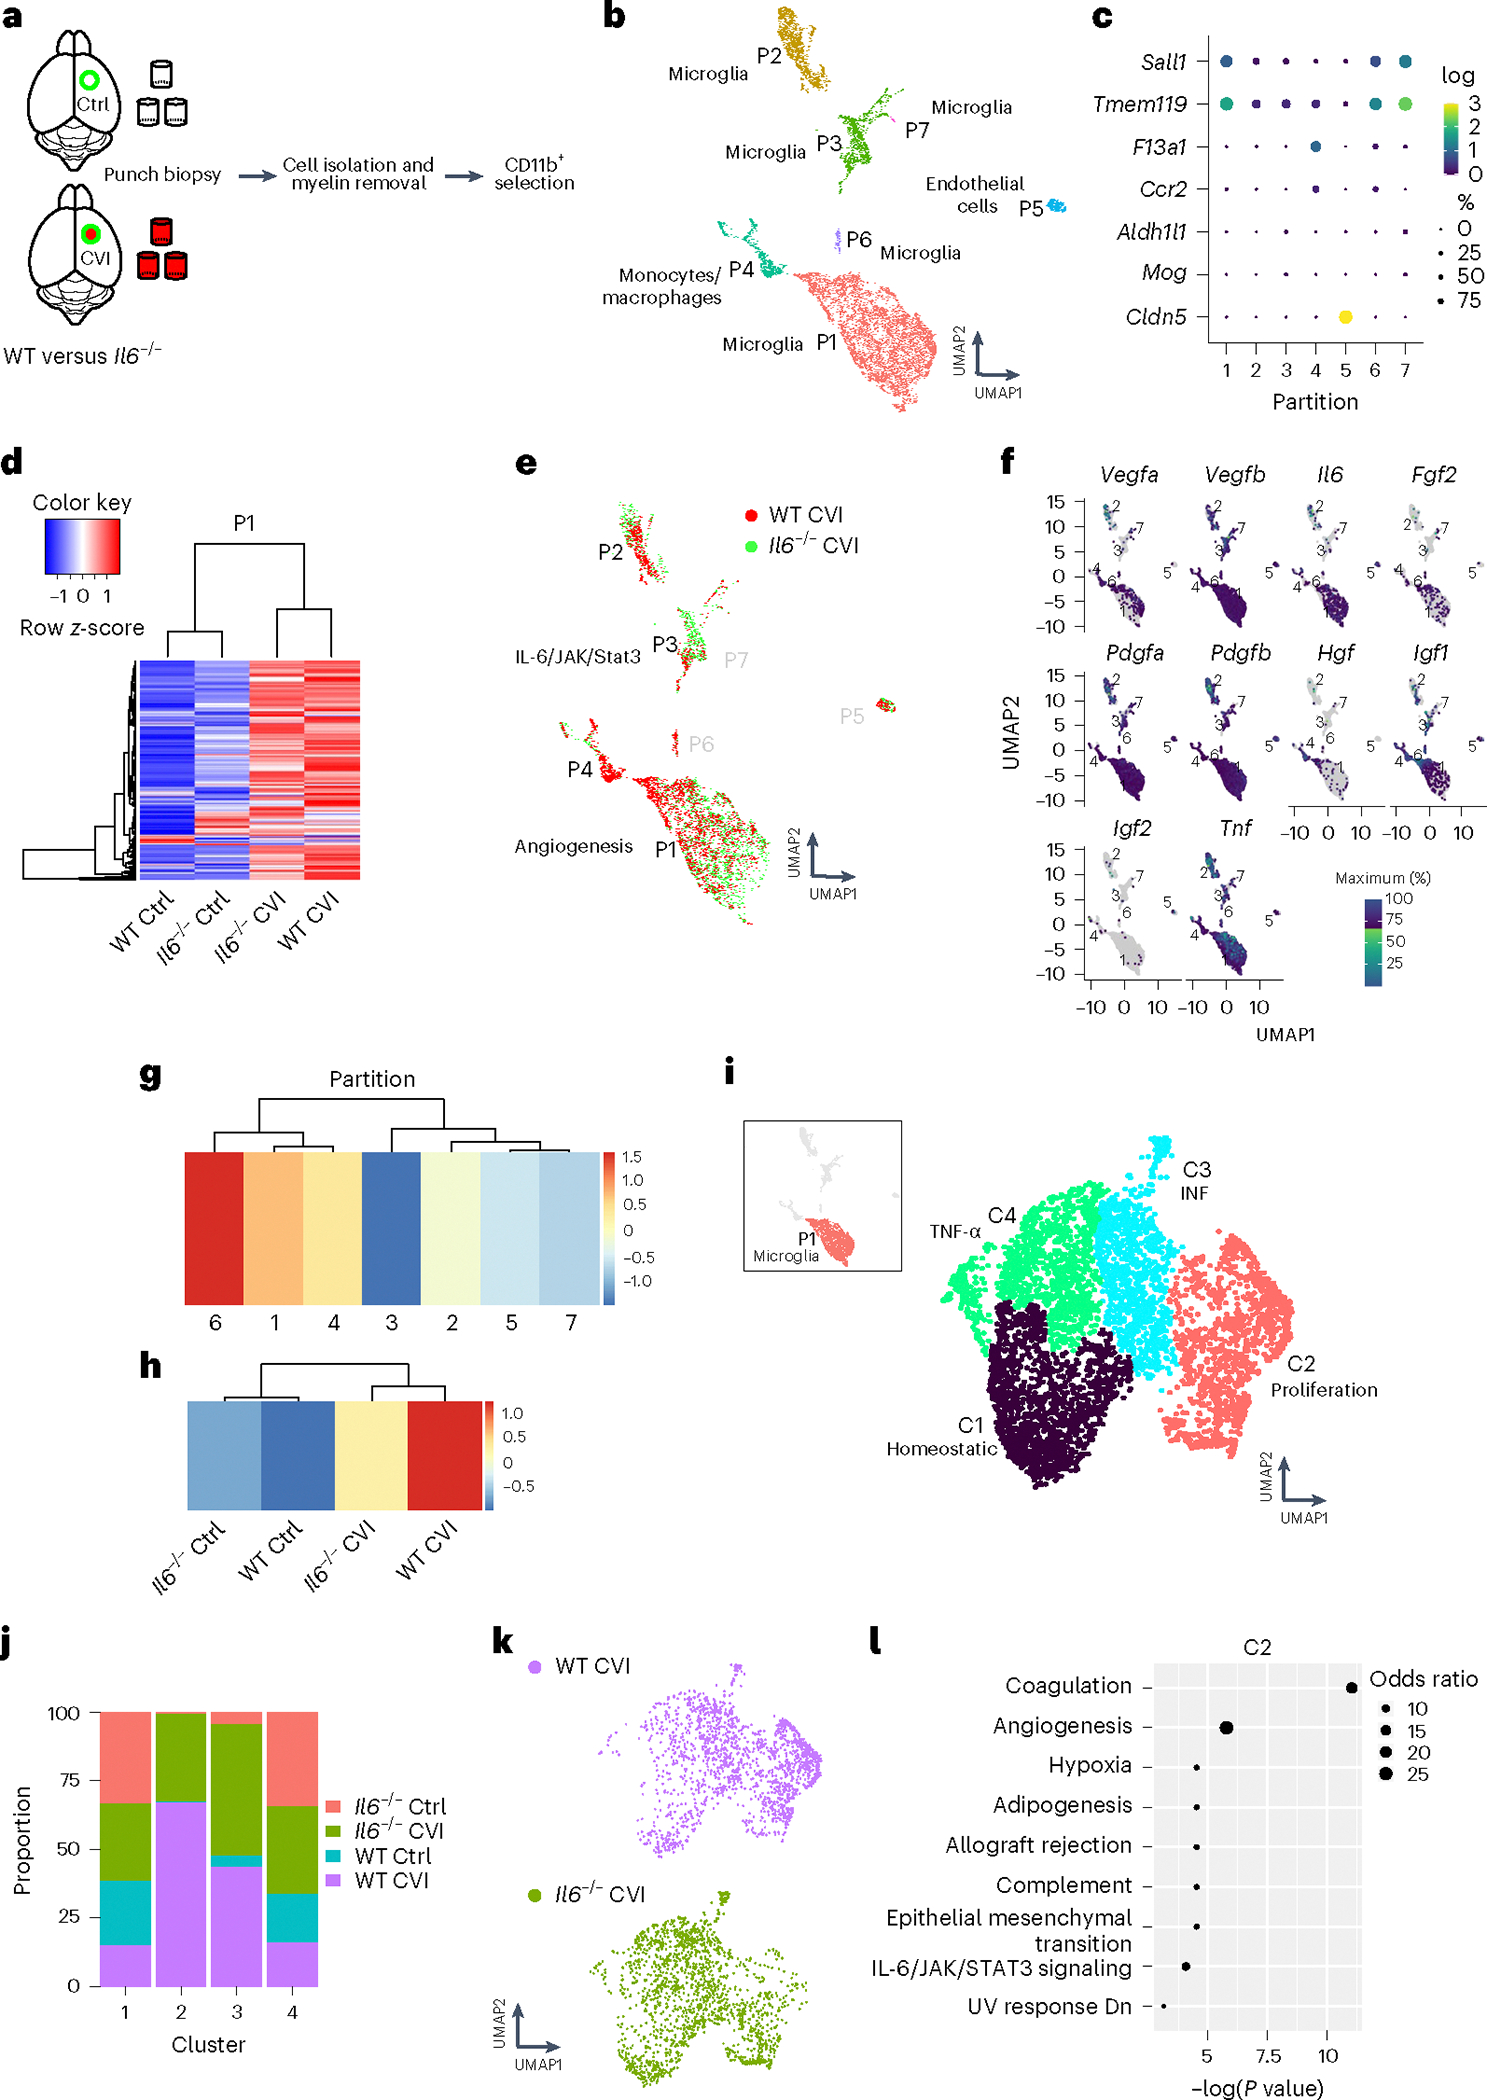
Fig. 4 |. ScRNA-seq reveals that IL-6 deficiency impairs proangiogenic microglial programming.

a, Schematic of how purified single-cell suspensions of CD11b+ cells were isolated for scRNA-seq via punch biopsy from the neocortex of WT versus Il6−/− mice at day 6 post-CVI. b, The UMAP depicts 7 different partitions based on 9,027 cells processed by scRNA-seq. Each dot represents a single cell and each color denotes a partition that is labeled with the corresponding cell type. c, Dot plots showing differential expression of canonical cell type markers for each partition. The dot size represents the percentage of cells within the partition that express the denoted gene and the color reflects the average expression level. d, A Pearson’s correlation-based clustered heatmap showing DEGs (q < 0.05) in P1 among uninjured (Ctrl) versus injured WT and Il6−/− mice. e, UMAP showing an all-partition comparison of WT versus Il6−/− CVI mice. The top pathway expressed in WT versus Il6−/− CVI based on DEGs is shown for P1 and P3. f, Expression of classic proangiogenic factors shown in each partition from all groups combined. g,h, Heatmaps showing the aggregated expression of the ten proangiogenic genes (denoted in f) per partition (g) and per experimental group (h). i, UMAP depicting drill-down analysis of P1, which revealed four clusters labeled with different colors. The top weighted signaling pathway for each cluster is listed. These pathways were identified using GSEA of DEGs (q < 0.05) between injured and uninjured mice. j, Bar graph showing the proportion of cells in each cluster of P1 that are attributed to the four denoted groups of mice. k, UMAPs depicting a side-by-side comparison of microglia P1 for WT versus Il6−/− CVI mice. l, Pathways revealed by GSEA of DEGs (q < 0.05) between WT and Il6−/− CVI mice in microglial P1 C2. Dot size corresponds to the odds ratio. Only statistically significant pathways (P < 0.05) are shown on the graph. Pathways are ordered based on −log(P value) multiplied by the corresponding z-score.
