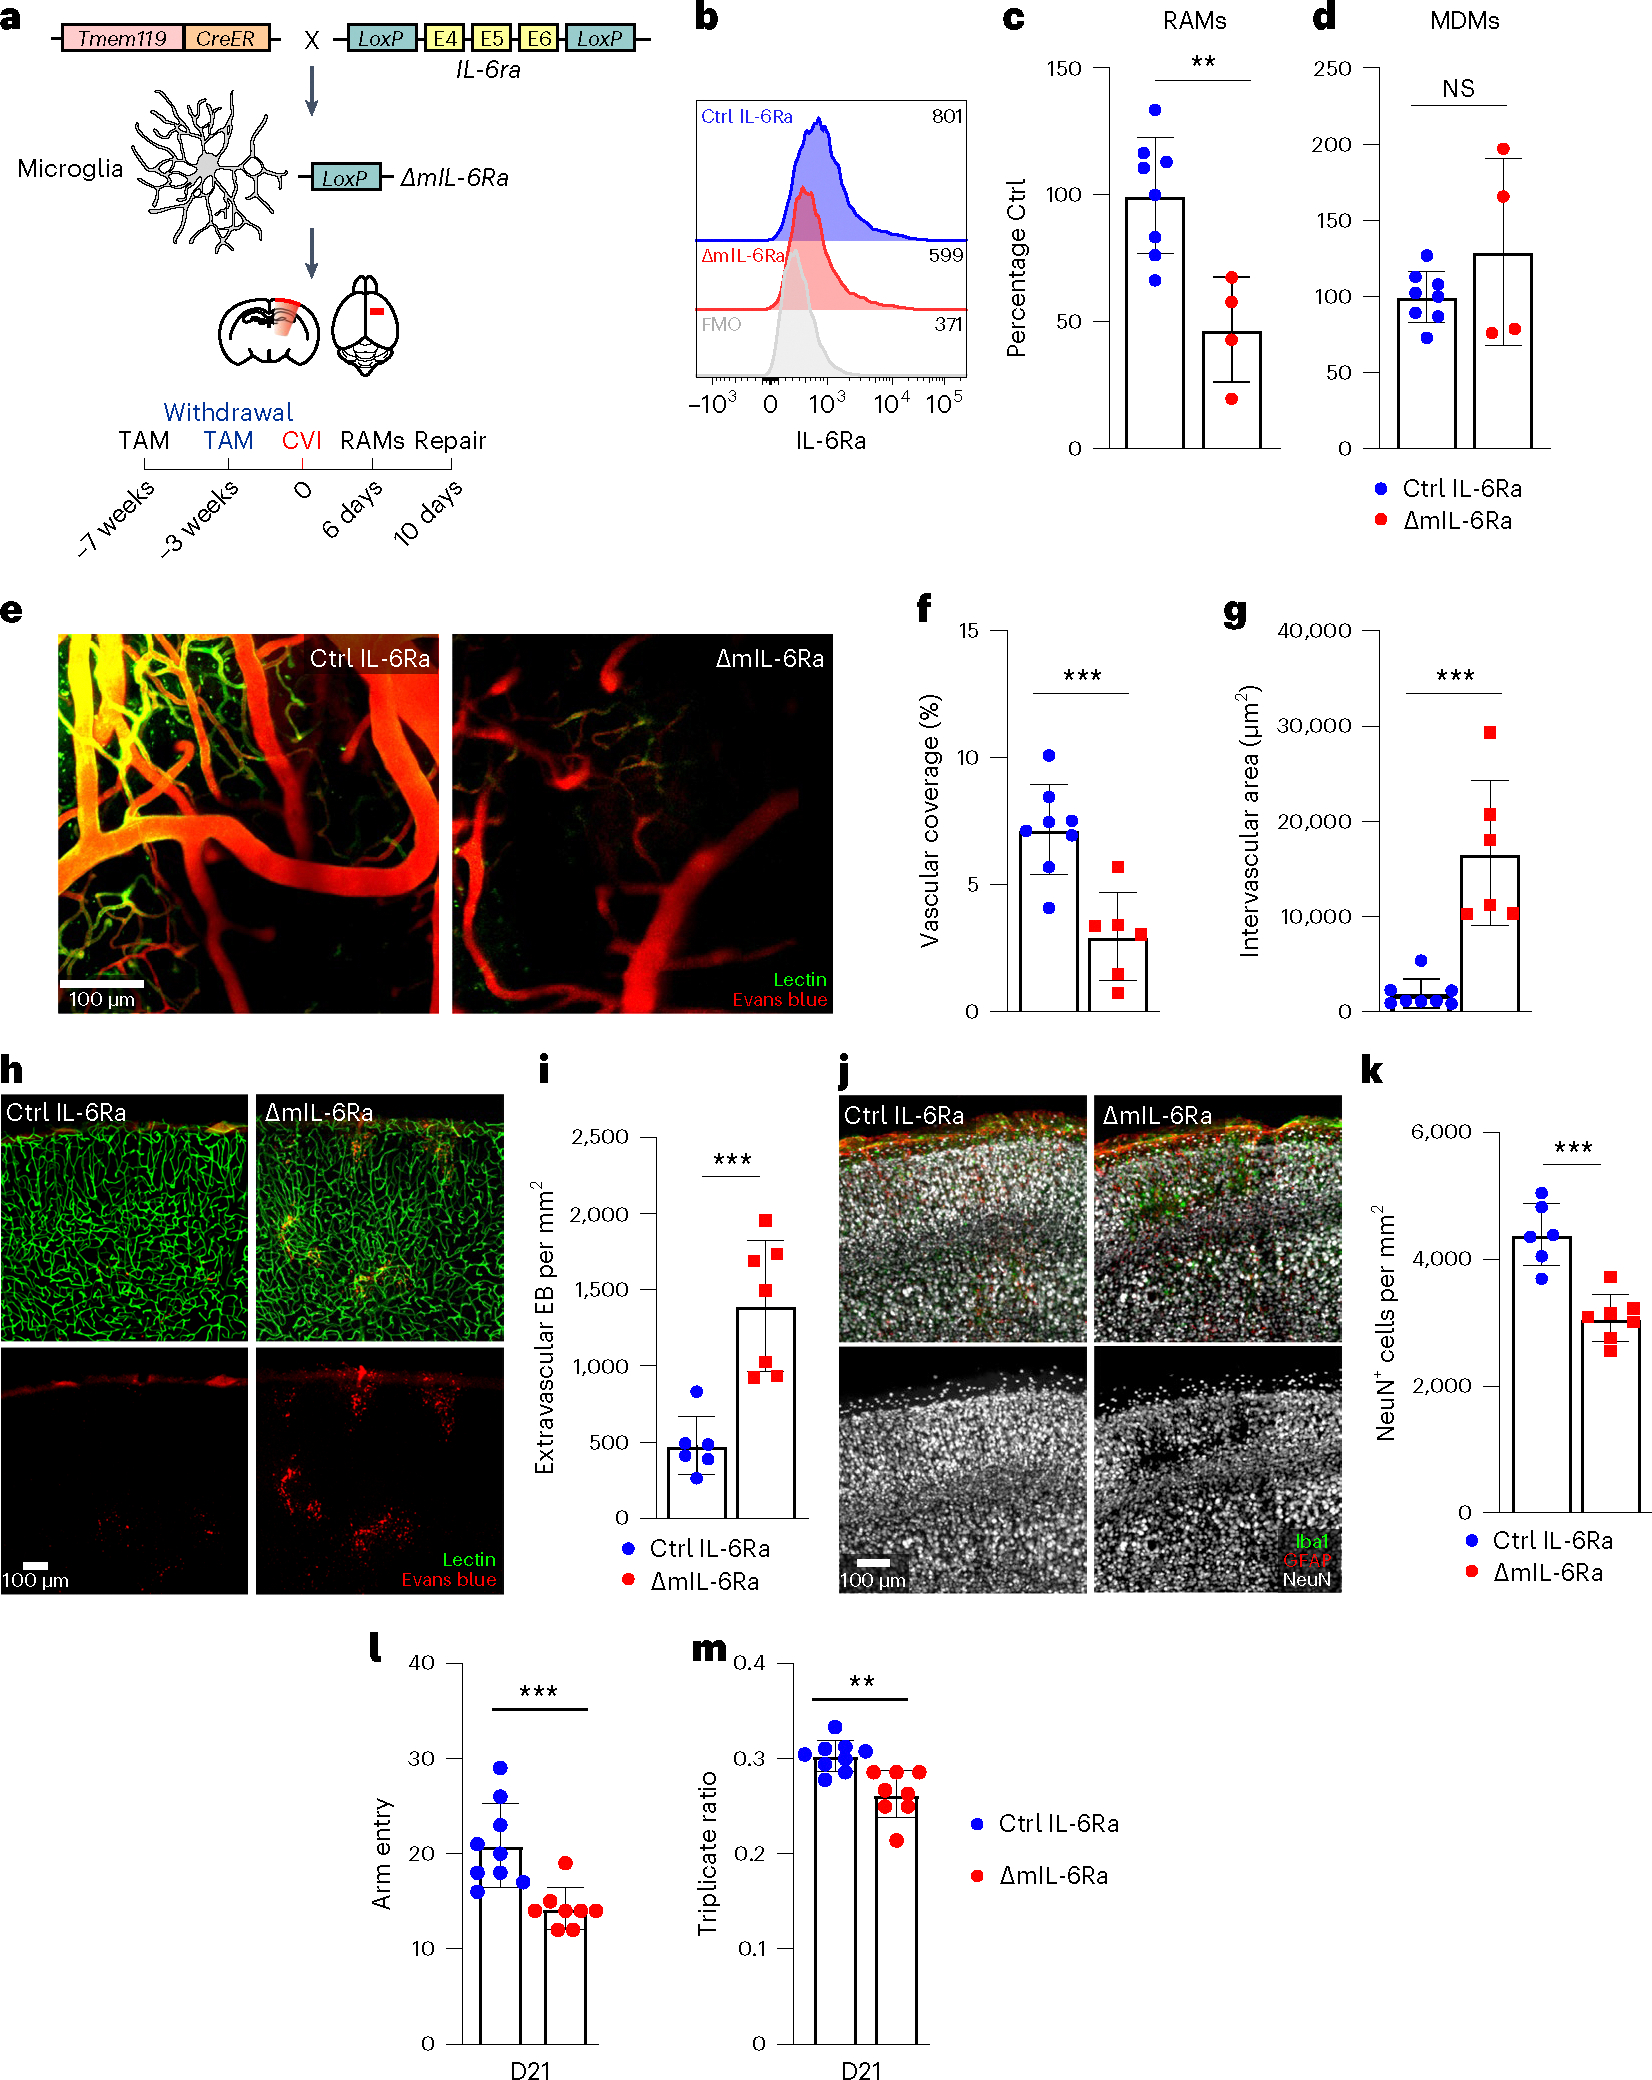
Fig. 6 |. Microglial IL-6 signaling contributes to RAM generation and vascular repair.

a, Schematic showing the experimental timeline and strategy used conditionally to delete IL-6Ra from microglia (ΔmIL-6Ra mice). b, Histograms showing the expression of membrane-bound IL-6Ra on CD45+CD11b+ cells obtained from the brains of Ctrl IL-6Ra (n = 3) and ΔmIL-6Ra (n = 1) mice on day 6 post-CVI relative to the FMO control (gray). Values in the histograms represent the median fluorescent intensity for each condition. Data represent two independent experiments. c,d, Bar graphs showing the percentage of RAMs (TdTo+VEGFA+IL-6Ra+CD24+CD44+CD206+CD11c+Ly6clo/int MHCIIloCX3CR1+CD11b+CD45lo/int) (c) and MDMs (TdTo−CD24+CD44+CD206+C D11c+Ly6c+CX3CR1+CD11b+CD45+) (d) determined by flow cytometric analysis of leukocytes isolated from cortical punch biopsies of ΔmIL-6Ra mice (n = 4) percentage normalized to their littermate Ctrl counterparts (n = 8) at day 6 post-CVI. Data are combined from three independent experiments. **P < 0.005; two-tailed, unpaired Student’s t-test. e, Representative TPM images showing vasculature through the thinned skull of Ctrl IL-6Ra (n = 8) versus ΔmIL-6Ra (n = 6) mice at day 10 post-CVI. Lectin (green) and EB (red) were injected i.v. to visualize vasculature. f,g, Bar graphs showing quantification of vascular coverage (f) and intervascular area (g) in the denoted groups in e. Data are combined from two independent experiments. ***P < 0.0005; two-tailed unpaired Student’s t-test. h, Representative confocal images of neocortex from Ctrl IL-6Ra (n = 6) versus ΔmIL-6Ra (n = 7) mice on day 10 post-CVI. Lectin (green) and EB (red) were injected i.v. to visualize vessels and measure BBB integrity. i, Bar graph showing the quantity of extravascular EB per mm2 of tissue in the denoted mice in h. Data are combined from two independent experiments. ***P < 0.0005; two-tailed, unpaired Student’s t-test. j, Representative confocal images of the neocortex from Ctrl IL-6Ra (n = 6) versus ΔmIL-6Ra (n = 7) mice at day 10 post-CVI stained for Iba1 (green), GFAP (red) and NeuN (white). k, Bar graph demonstrating the number of NeuN+ neurons per mm2 of tissue in the denoted mice in j. Data are combined from two independent experiments. ***P < 0.0005; two-tailed, unpaired Student’s t-test. l,m, Bar graphs depicting the total number of Y-maze arm entries (l) and the triplicate ratio (m) for Ctrl IL-6Ra (n = 9) and ΔmIL-6Ra (n = 8) mice at day 21 post-CVI. Combined data from two independent experiments are shown. **P < 0.005; two-tailed, unpaired Student’s t-test. All graphs show mean ± s.e.m. The dots represent individual animals.
