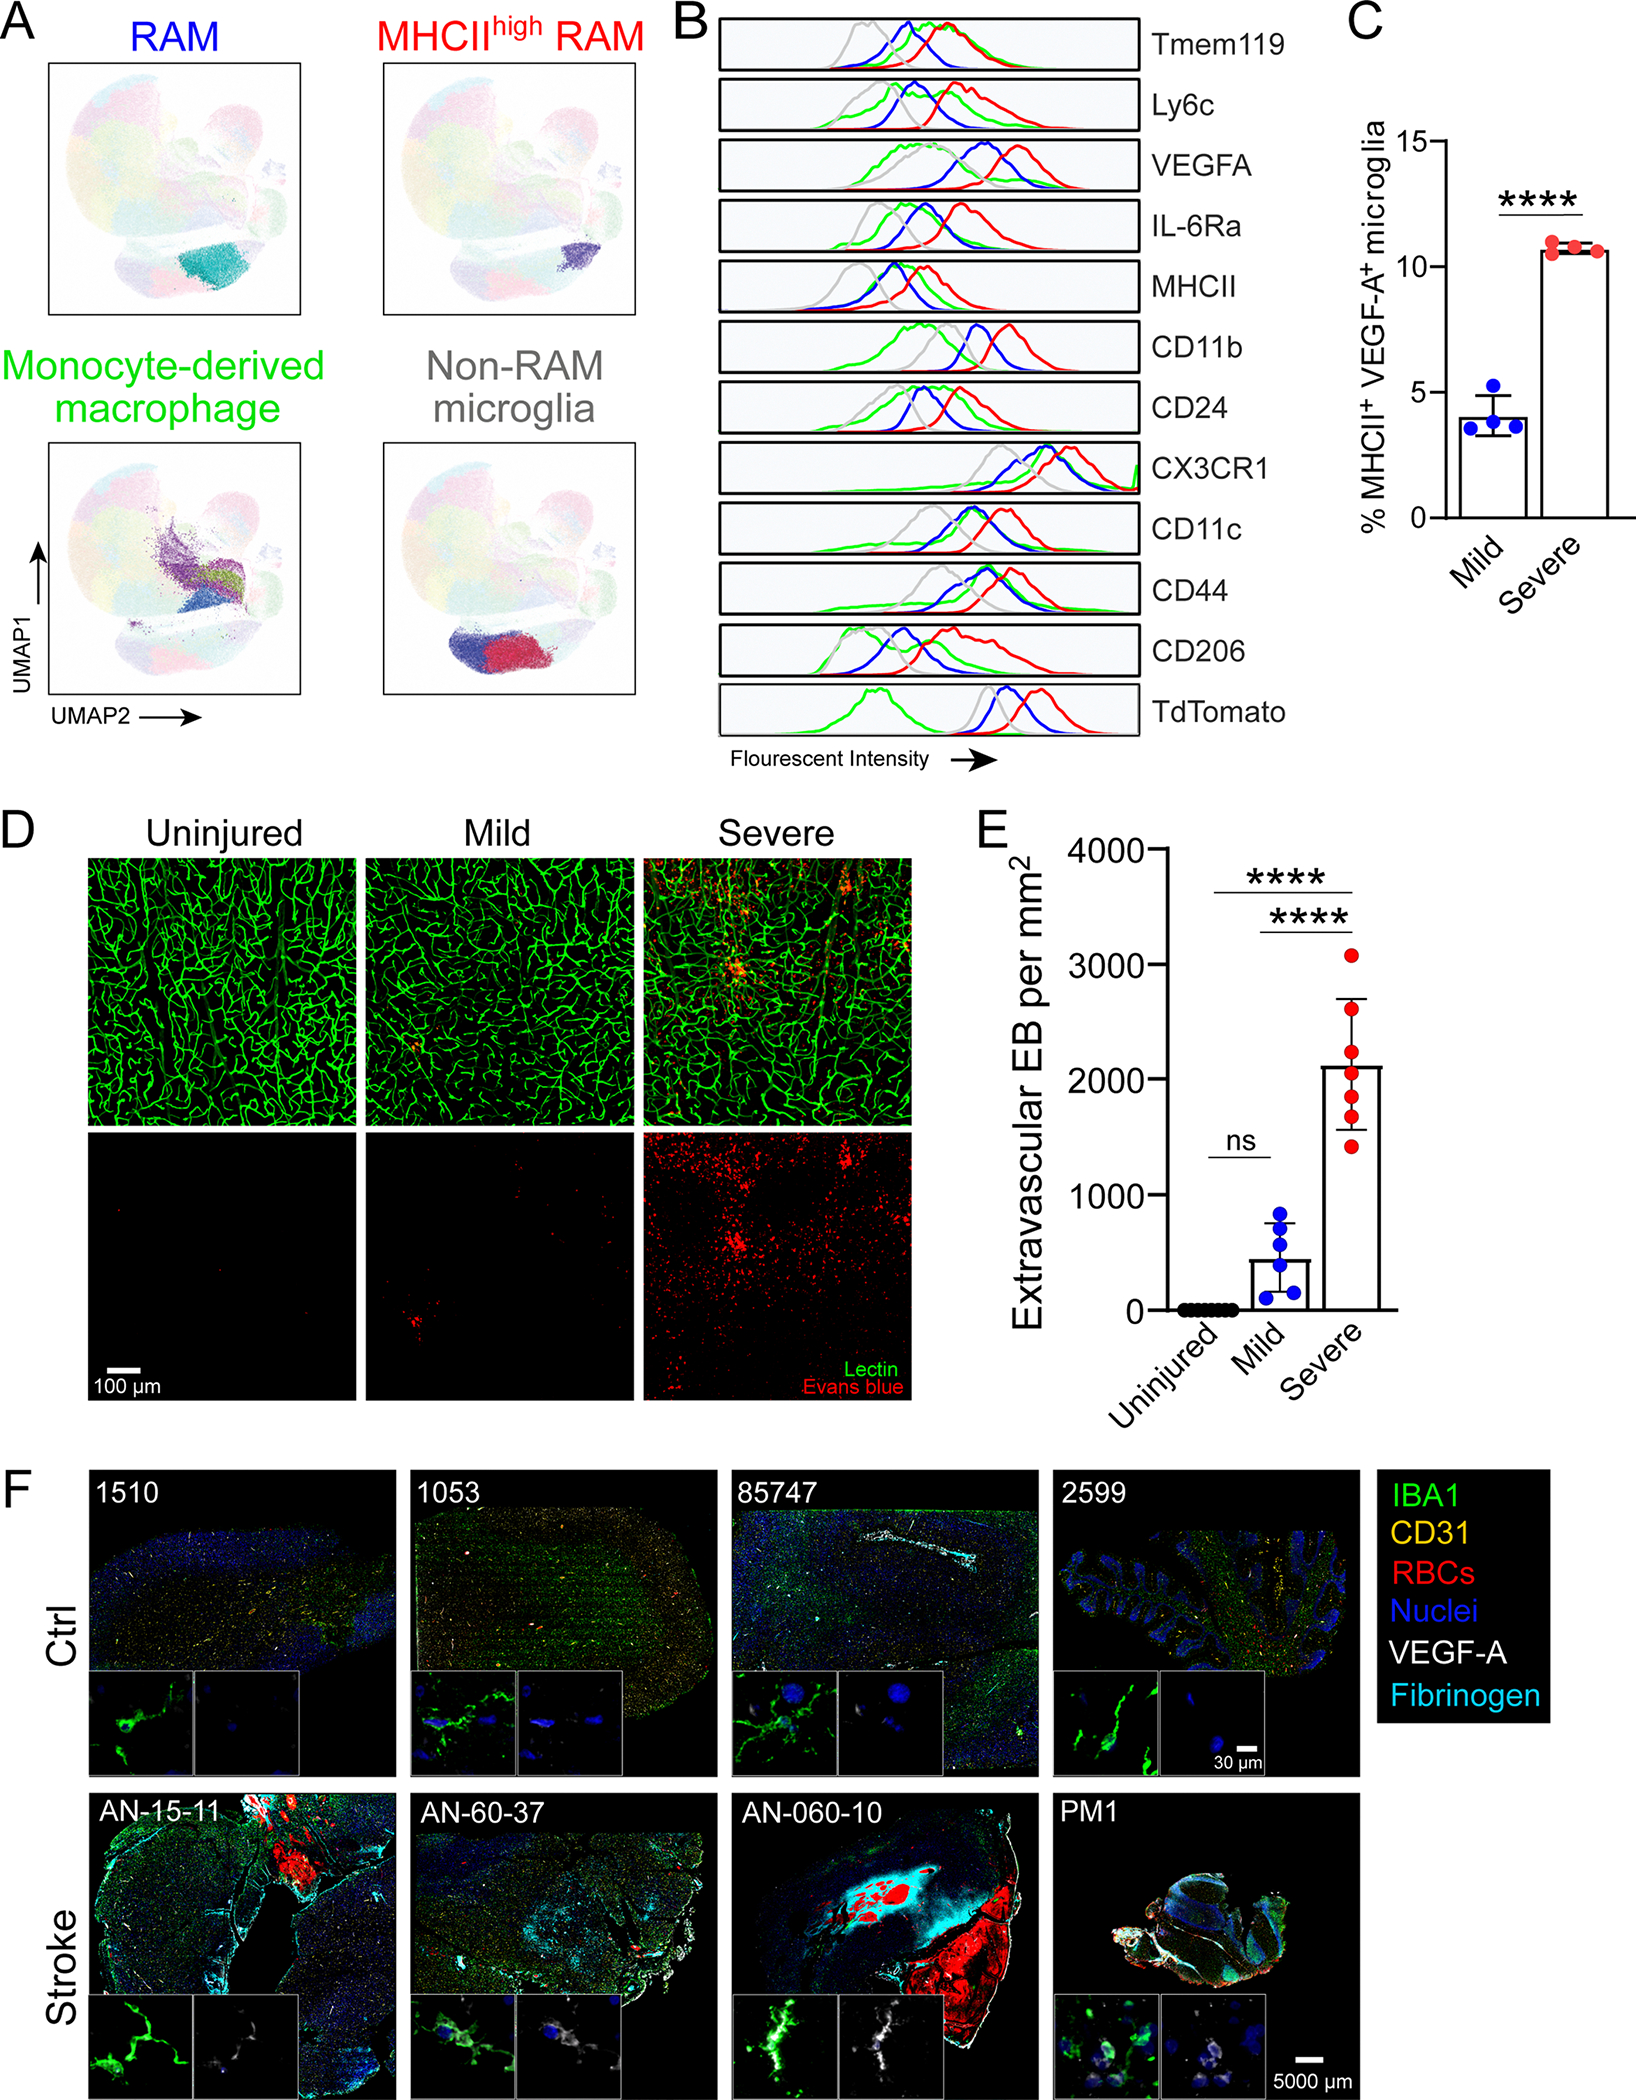
Extended Data Fig. 2 |. Mild versus severe CVI in mice and immunohistochemical staining of human brain tissue.

a, Dimensionality reduction plots generated using Cluster Explorer show RAM (blue), MHC IIhi RAM (red), non-RAM microglia (gray), and MDM (green) in Tmem119-TdTo mice on D6 post CVI. Plots show concatenated samples obtained from mild (n=4) and severe (n=4) WT CVI mice described in Fig. 2. The gating strategy for the different myeloid subsets is described in Fig. 2b–d. Data are representative of two independent experiments. b, Histograms show expression of the indicated markers by the different myeloid cell populations (a). c, Bar graph shows the percentage of MHCII+ VEGFA+ microglia in the brains of D6 Tmem119-TdTo mice described in Fig. 2a–d following mild versus severe CVI (****P<0.0001; two-tailed unpaired t test). d, Immunofluorescent staining of neocortical vasculature in uninjured Ctrl (n=8) as well as mild (n=6) and severe (n=7) CVI mice at day 10. Lectin (green) and Evans blue (red) were injected i.v. to visualize vessels and BBB disruption. e, Quantification showing numbers of extravasated dye among the groups of animals (Ctrl=8, mild CVI=6, and severe CVI=7). Data are combined from two independent experiments. (****P<0.0001; one-way ANOVA with Tukey’s test). All graphs show mean ± SEM. Dots represent individual mice. f, Multiplex immunostaining of human stroke (n=4) versus Ctrl (n=4) brain tissue (see Supplementary Table 1) showing expression of IBA1, CD31, glycophorin A (red blood cells, RBCs), VEGF-A, fibrinogen, and DAPI (cell nuclei). All images are comparably scaled. The magnified images in the bottom of each image depict VEGF-A (white) expression in IBA1+ myeloid cells (green).
