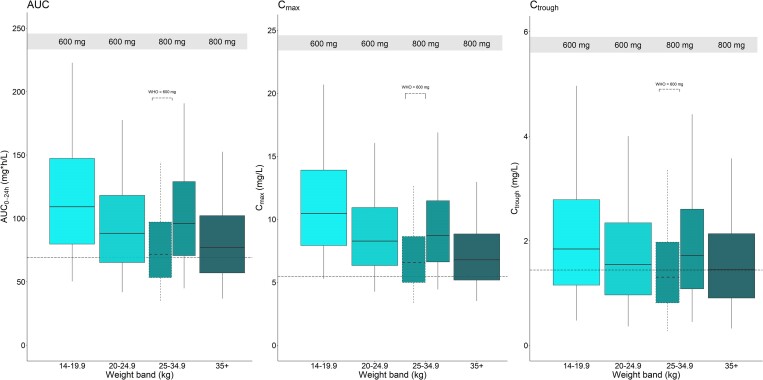
Figure 4.
Simulated steady-state darunavir area under the curve from 0 to 24 h (AUC0–24h), maximum concentrations (Cmax) and trough concentrations (Ctrough) versus weight band, with concentrations achieved after administration of the weight-based dosing used in CHAPAS-4. The box with dashed boundaries shows the WHO-recommended dosing for the weight band where it differs from CHAPAS-4. The black dashed horizontal lines (from left to right) represent the reported adult median AUC0–24h (69.4 h mg/L), mean Cmax (5.5 mg/L) and mean Ctrough (1.4 mg/L), respectively.14 The boxes indicate the interquartile range and the whiskers the 95% range.

