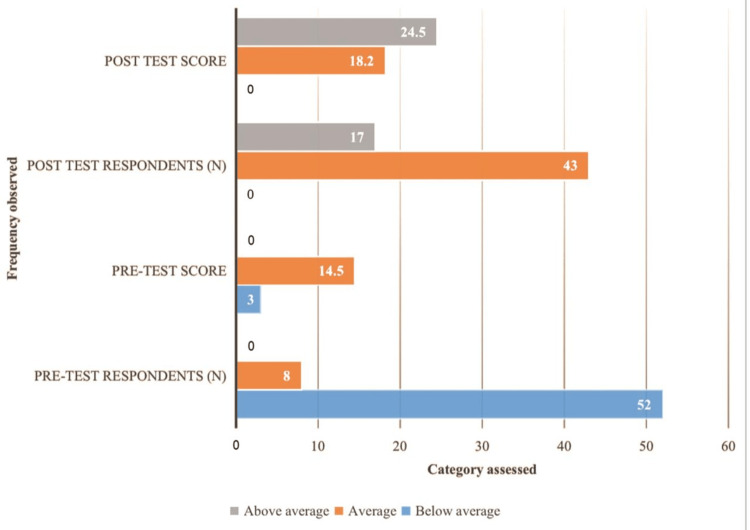
Figure 1. Pre- and post-test scores.
Participants were divided into three groups: below average, average, and above average. In the pre-test, no participants scored in the above average group, and thus the number of respondents and the pre-test score for this group were both 0. In the post-test, no participants scored in the below-average group, and thus the number of respondents and the post-test score for this group were also 0. Therefore, the zeros in the pre-test and post-test scores indicate this.

