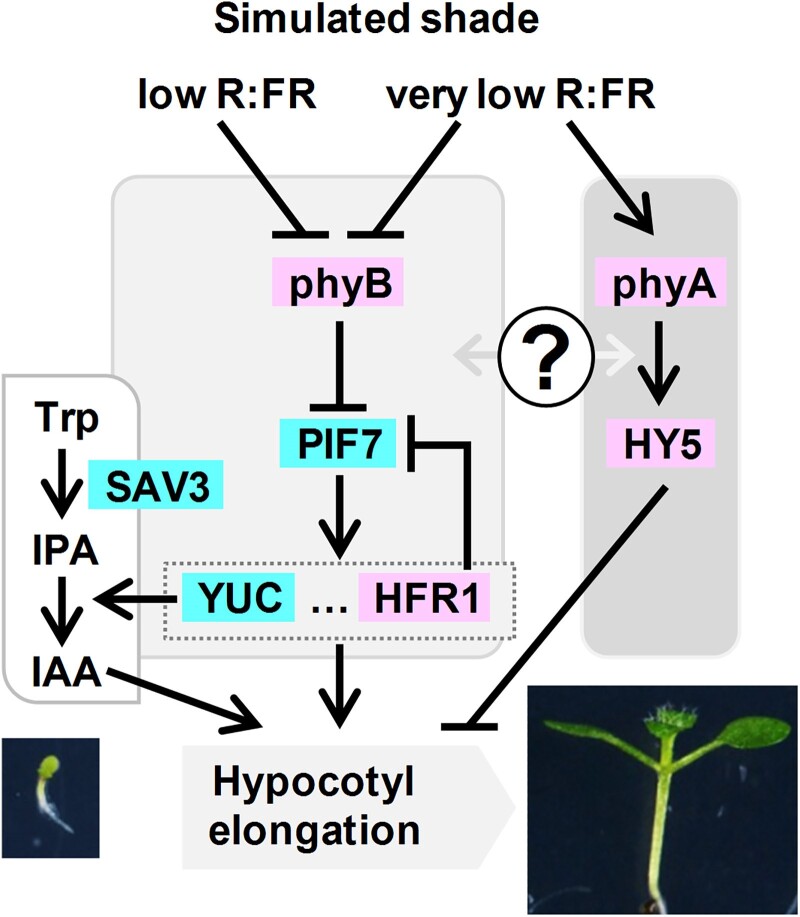
Figure 1.
Simplified model that depicts the genetic components analyzed in this work involved in plant neighbor detection. Color indicates the positive (blue) or negative (pink) contribution to the shade-induced hypocotyl elongation. Aspect of representative seedlings just before (W-grown 2-d-old, bottom left) and after the shade treatment (shade-grown 7-d-old, bottom right) is shown. Arrows indicate positive and bars represent negative regulatory relationships. Question mark indicates an unknown regulatory relationship between the connected components.

