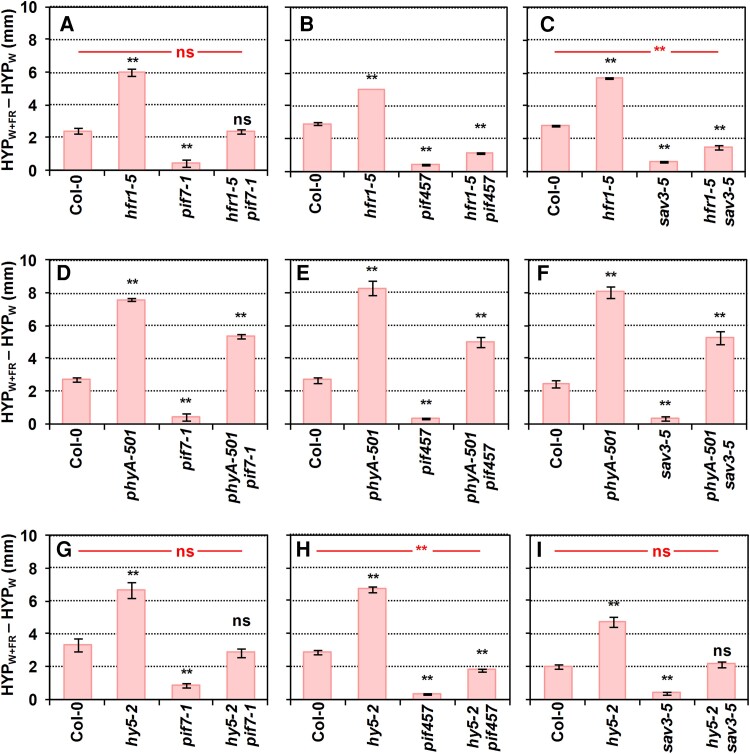
Figure 4.
Genetic interaction of pairs of SAS-negative and -positive regulators in the shade-induced hypocotyl elongation. Difference of hypocotyl length (HYP) in simulated shade, W + FR (HYPW + FR) and W (HYPW) of Col-0 (A) hfr1-5, pif7-1, hfr1-5 pif7-1, B) hfr1-5, pif457, hfr1-5 pif457, C) hfr1-5, sav3-5, hfr1-5 sav3-5, D) phyA-501, pif7-1, phyA-501 pif7-1, E) phyA-501, pif457, phyA-501 pif457, F) phyA-501, sav3-5, phyA-501 sav3-5, G) hy5-2, pif7-1, hy5-2 pif7-1, H) hy5-2, pif457, hy5-2 pif457, and I) hy5-2, sav3-5, and hy5-2 sav3-5. Seedlings were grown as in Fig. 2A. Means and Se of 3 independent replicates were used to calculate the shown values of HYPW + FR − HYPW and to propagate the Se. Error bars are the propagated Se. Asterisks indicate significant differences (based on the 2-way ANOVA) between the mutant and wild-type genotypes in response to simulated shade (**P < 0.01; ns, not significant).

