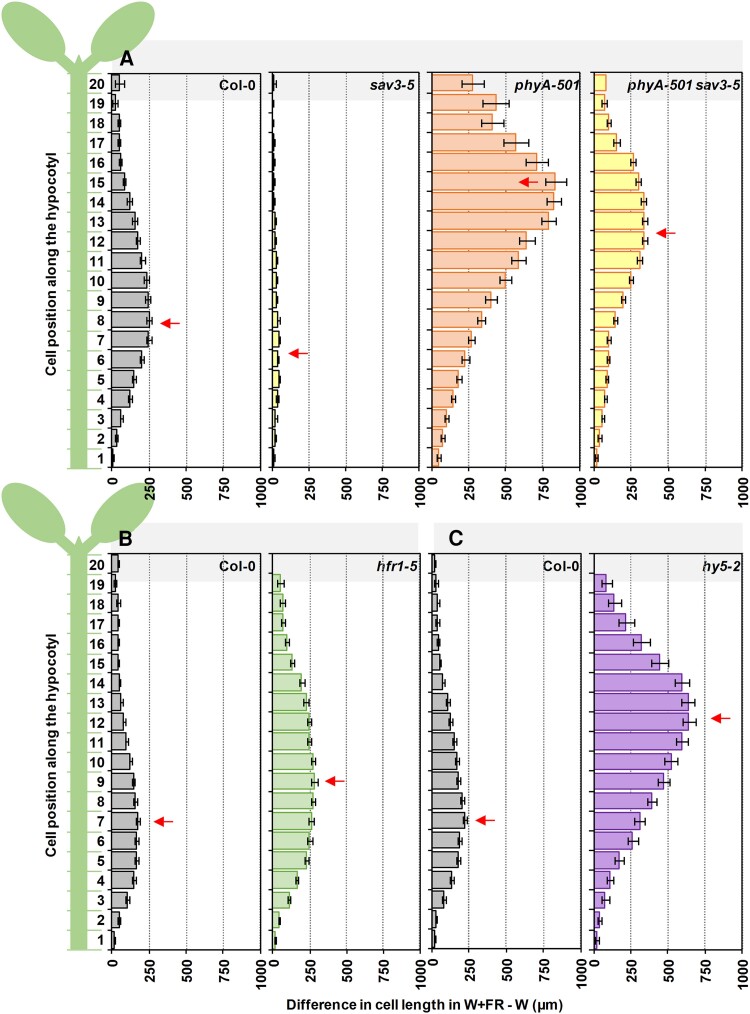
Figure 7.
Distribution of the epidermal cell length from base to top induced by simulated shade in hypocotyls of wild-type or SAS mutant seedlings. Schematic representation of the 20 cells composing a cell row of the epidermis along the longitudinal axis of an A. thaliana hypocotyl (left). Difference in length in simulated shade (W + FR) and W for each of the 20 epidermal cells in hypocotyls of Col-0, A) sav3-5, phyA-501, phyA-501 sav3-5, B) hfr1-5, and C) hy5-2. Seedlings were grown as in Fig. 2A. Arrows point to cell with a highest difference in length. Values have been estimated after mean lengths of at least 15 cells of 2 cell rows per hypocotyl from 7 different hypocotyls per genotype and growth condition. Error bars represent Se.

