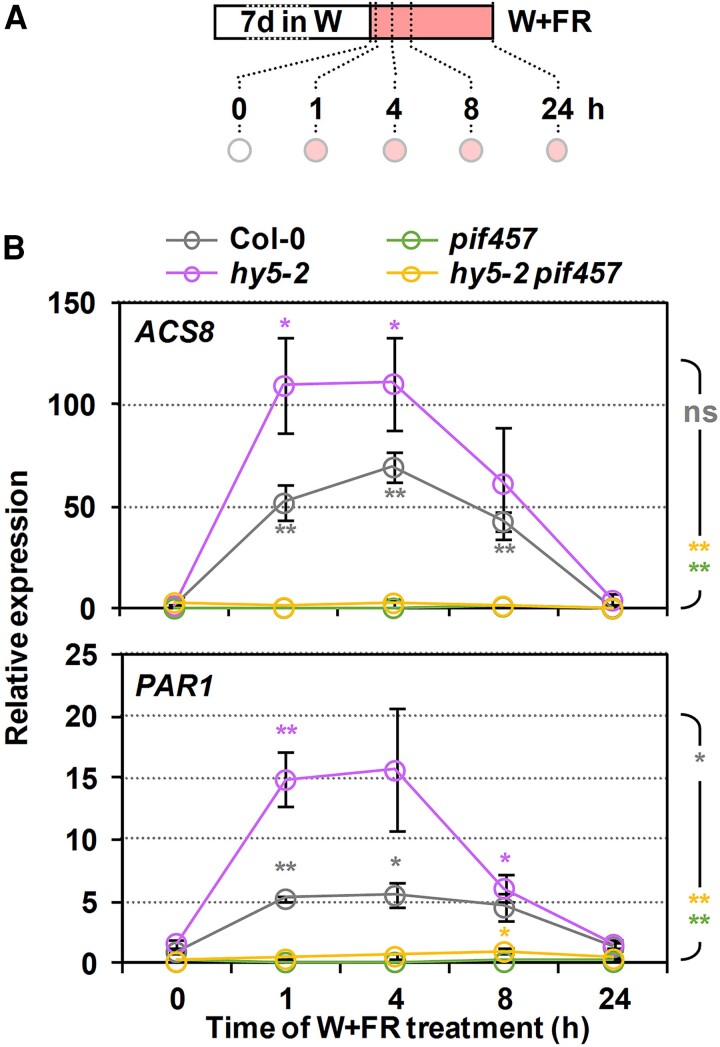
Figure 8.
Effect of hy5 and pif457 mutations on the shade regulation of the expression of ACS8 and PAR1. A) Cartoon of the experiment design. Seeds were grown for 7 d under W and then transferred to simulated shade (W + FR, R:FR = 0.02) for the indicated time before harvesting samples (circles). B) Relative expression of ACS8 (top) and PAR1 (bottom) in Col-0, hy5-2, pif457, and hy5-2 pif457 at the indicated times of simulated shade treatment. Values are means and error bars are Se of 3 independent biological replicates. Expression is presented relative to the Col-0 genotype at 0 h. Asterisks around the symbols indicate significant differences (Student's t-test) relative to the same genotype at 0 h. Asterisk at the right indicate significant differences between the different mutants and the wild type in response to simulated shade (2-way ANOVA); ns, not significant, *P < 0.05, **P < 0.01.

