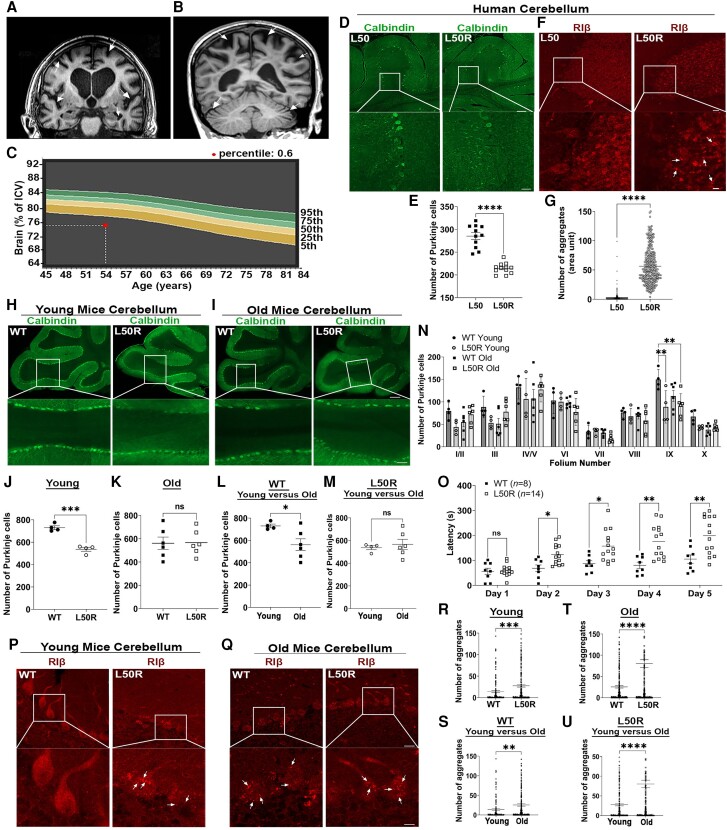
Figure 1.
The RIβ-L50R mouse model recapitulates neuronal loss, protein aggregation and exhibits behavioural changes. (A) Coronal MRI image of a previously described individual heterozygous for the RIβ-L50R mutation.4 (B) Sagittal MRI image from a newly described individual with RIβ-L50R mutation. Arrows point to regions with atrophy in the cortex and cerebellum. (C) Quantification of brain atrophy as defined by percentage of intracranial volume (ICV) plotted against the reference centile curves in a normal population. The red dot represents the ICV of the new individual compared to the normal volume. (D) Human cerebellar tissue of a healthy individual (L50) and an L50R individual were immuno-stained with anti-calbindin antibody. Images acquired at ×20 magnification were stitched to form a larger picture. The white box represents the area from which subfield full-resolution images were captured. Scale bar = 200 µm; for enlarged image = 50 µm. (E) Quantification analysis of number of Purkinje cells. Each dot represents the total number of Purkinje cells in folia. (F) Cerebellum slice from a healthy individual (L50) and a patient heterozygous for the L50R generating mutation (L50R) were immuno-stained with anti-RIβ antibody. Protein aggregations are denoted by white arrows. Scale bar = 50 µm; for enlarged image = 20 µm. (G) Numbers of aggregates per unit were taken from three slices (100 dots per slice). Error bars represent ±standard error of the mean (SEM). Unpaired t-test. ****P < 0.0001. (H and I) Cerebellum slices from wild-type (WT) or L50R young mice (3–4 months old) (H) or old mice (16–20 months old) (I) immuno-stained with anti-calbindin antibody. Scale bar = 200 µm; enlarged image of folium number IX, scale bar = 50 µm. (J–M) Paired comparison analyses for number of Purkinje cells in a whole mouse folia for WT/RIβ-L50R and/or young/old mice as denoted. Each dot represents the number in a different mouse. (N) Quantitative analysis of total number of Purkinje cells in each individual lobule of mice cerebella. Two-way ANOVA with Tukey’s post hoc test. (O) Motor performance changes measured using the accelerating rotarod test for WT (n = 8) and L50R (n = 14) old mice (>16 months old). Three tests were performed per day for 5 days. Each dot represents one mouse. Error bars represent SEM. Repeated measures ANOVA with Šídák correction for multiple testing. *P < 0.05, **P < 0.01, ***P < 0.001, ns = non-significant comparison. (P and Q) Cerebellum slices from WT or L50R young mice (3–4 months old) (P) or old mice (16–18 months old) (Q) immuno-stained with anti-RIβ antibody. (R–U) Image quantification of RIβ protein aggregation per Purkinje cell of either WT and/or L50R young mice (3–4 months old) and/or old mice (16–18 months old). Paired comparison analyses performed as denoted in each graph. Each dot represents the number of aggregates per cell. Error bars represent ±SEM. Unpaired t-test. **P < 0.01, ***P < 0.001, ****P < 0.0001.

